
QNT consolidates near $63.85 as bearish momentum persists and weekly RSI signals oversold conditions – weekly forecast

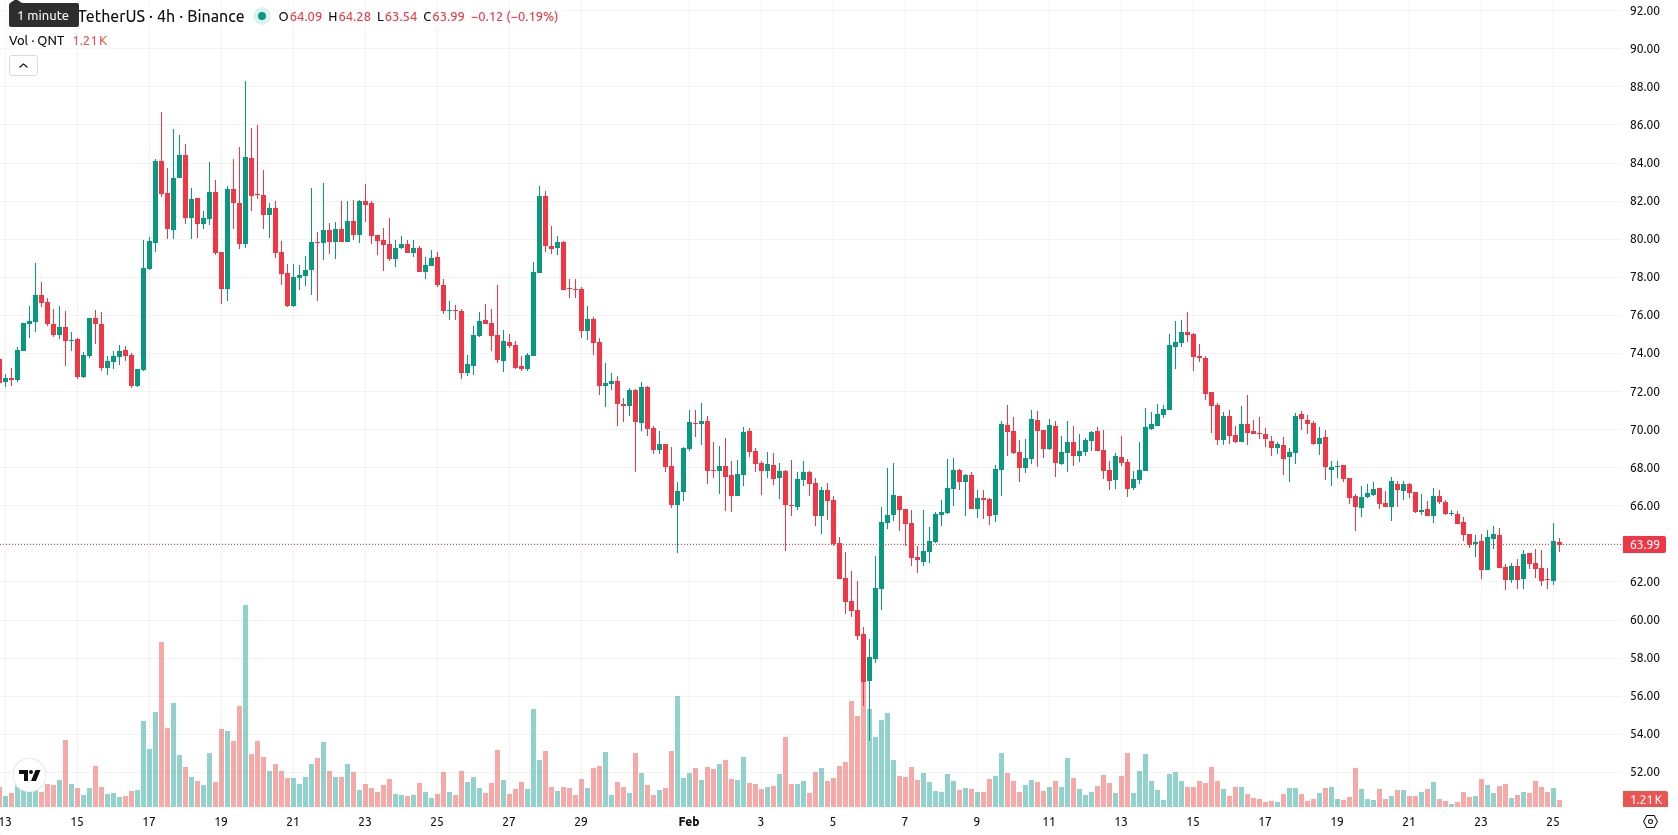
Quant (QNT) is currently trading at $63.85, marking a retreat for the week and positioning the asset below all major weekly moving averages, including the MA-20 at $67.18, MA-50 at $72.10, and MA-200 at $86.03. This underscores steady downward pressure over the past seven days, with the current price well under both short- and long-term dynamic averages.
Highlights
- QNT is trading at $63.85, below the MA-20 ($67.18), MA-50 ($72.10), and MA-200 ($86.03), confirming persistent bearish technical pressure.
- Momentum indicators are mixed: MACD remains in sell zone, while RSI (38), Stochastic RSI, and CCI show strong oversold conditions with seller dominance intraday.
- A break above immediate resistance at $64.87 is needed for potential recovery, while loss of $61.80 support points to a decline toward $58.00; baseline scenario is sideways ($58.00–$68.00).
Bearish momentum confirmed as technicals remain oversold for the week
On the weekly timeframe, all key moving averages for QNT remain overhead, confirming persistent bearish momentum. The closest dynamic resistance is located at the Ichimoku Kijun level of $64.87, while immediate support aligns with recent session lows near $61.80. Weekly momentum signals continue to favor sellers, with the RSI on W1 at 38, Stochastic RSI and CCI both indicating oversold conditions, and the MACD in sell territory. The Awesome Oscillator is negative, and the overall trend, as measured by the weekly ADX, remains weak but structurally bearish.
Sideways bias expected as oversold pressures and resistance limit recovery
Looking ahead to the next 5–7 trading days, QNT is likely to trade within a sideways corridor between $58.00 and $68.00, according to weekly indicator readings. Continuation of current oversold levels suggests a low probability (less than 20%) of a sharp recovery. The baseline forecast points to consolidation, with upside potential capped unless resistance at $64.87 is convincingly broken. A drop below $61.80 could trigger a move toward $58.00 or lower, while sustained closes above $64.87 would be needed to signal the start of a reversal.
Last time, analysts noted that Quant is trading above short-term support but remains below its medium- and long-term moving averages, indicating persistent bearish pressure despite modest recent gains. Technical indicators present a mixed outlook with weak momentum—RSI and MACD leaning bearish—while key resistance remains overhead, reinforcing expectations for continued consolidation or mild downside in the near term.


-
 Afghanistan
-
 Albania
-
 Algeria
-
 Angola
-
 Argentina
-
 Armenia
-
 Australia
-
 Austria
-
 Azerbaijan
-
 Bahamas
-
 Bahrain
-
 Bangladesh
-
 Belarus
-
 Belgium
-
 Bolivia
-
 Botswana
-
 Brazil
-
 Brunei
-
 Bulgaria
-
 Cambodia
-
 Cameroon
-
 Canada
-
 Chile
Chile
-
 China
China
-
 Colombia
-
 Congo
Congo
-
 Costa Rica
-
 Cote d'Ivoire
-
 Croatia
-
 Cuba
Cuba
-
 Cyprus
-
 Czechia
-
 DR Congo
-
 Denmark
-
 Dominican Republic
-
 Ecuador
-
 Egypt
Egypt
-
 El Salvador
-
 Estonia
-
 Eswatini
-
 Ethiopia
-
 Finland
-
 France
-
 Georgia
-
 Germany
-
 Ghana
Ghana
-
 Greece
-
 Haiti
Haiti
-
 Hong Kong
-
 Hungary
-
 India
India
-
 Indonesia
-
 Iran, Islamic republic
-
 Iraq
Iraq
-
 Ireland
-
 Israel
-
 Italy
Italy
-
 Jamaica
-
 Japan
Japan
-
 Jordan
-
 Kazakhstan
-
 Kenya
Kenya
-
 Korea
Korea
-
 Kuwait
-
 Kyrgyzstan
-
 Laos
Laos
-
 Latvia
-
 Lebanon
-
 Lesotho
-
 Libya
Libya
-
 Lithuania
-
 Luxembourg
-
 Madagascar
-
 Malaysia
-
 Malta
Malta
-
 Mauritius
-
 Mexico
-
 Moldova
-
 Mongolia
-
 Montenegro
-
 Morocco
-
 Mozambique
-
 Myanmar
-
 Namibia
-
 Nepal
Nepal
-
 Netherlands
-
 New Zealand
-
 Nigeria
-
 North Macedonia
-
 Norway
-
 Oman
Oman
-
 Pakistan
-
 Palestine
-
 Panama
-
 Papua New Guinea
-
 Paraguay
-
 Peru
Peru
-
 Philippines
-
 Poland
-
 Portugal
-
 Puerto Rico
-
 Qatar
Qatar
-
 Reunion
-
 Romania
-
 Rwanda
-
 Saudi Arabia
-
 Serbia
-
 Singapore
-
 Slovakia
-
 Slovenia
-
 Somalia
-
 South Africa
-
 Spain
Spain
-
 Sri Lanka
-
 Sweden
-
 Switzerland
-
 Syria
Syria
-
 Taiwan
-
 Tajikistan
-
 Tanzania
-
 Thailand
-
 Trinidad and Tobago
-
 Tunisia
-
 Turkey
-
 UAE
UAE
-
 Uganda
-
 Ukraine
-
 United Kingdom
-
United States
-
 Uruguay
-
 Uzbekistan
-
 Venezuela
-
 Vietnam
-
 Yemen
Yemen
-
 Zambia
-
 Zimbabwe
- Forex
- Crypto
