
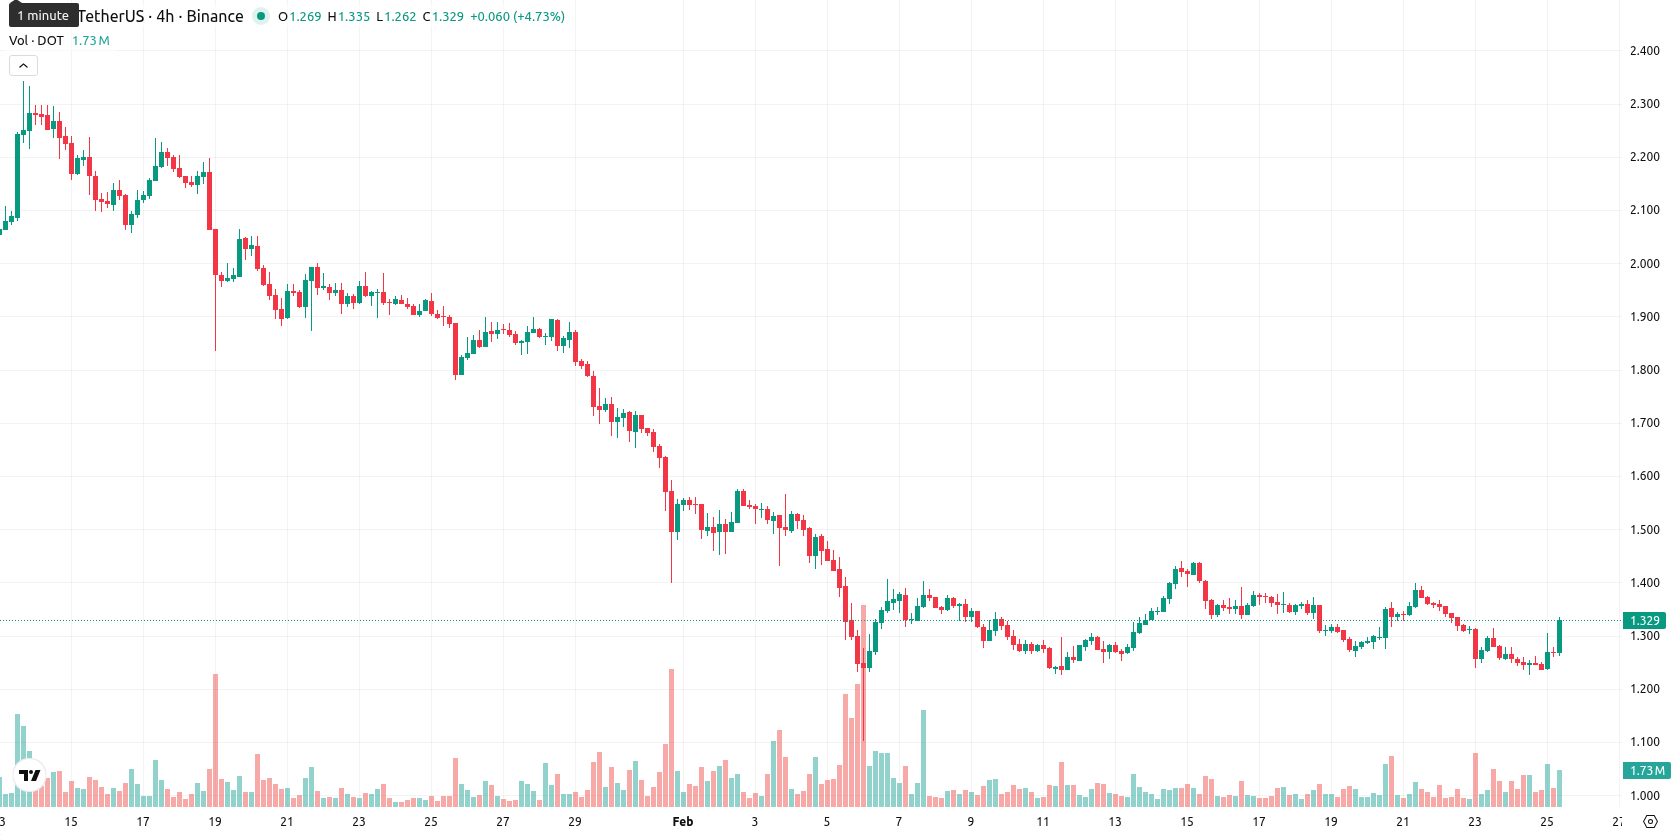
Short-term rebound clashes with bearish momentum — Polkadot gains 7.00%

Polkadot (DOT) is trading at $1.329 after a 7.00% gain today. The price stands just above the MA-20 ($1.321) but remains well below the MA-50 ($1.686) and MA-200 ($2.772), highlighting short-term upside while medium- and long-term trends continue to pressure DOT lower. The Ichimoku Kijun at $1.425 acts as immediate resistance.
Highlights
- DOT's current price at $1.329 sits just above the MA-20 ($1.321) but remains well below both the MA-50 ($1.686) and MA-200 ($2.772), reflecting medium- and long-term bearish pressure.
- Momentum indicators including daily MACD, ADX, low RSI (34), and deep oversold CCI all signal persistent bearish strength despite a 7.00% intraday rise.
- Key range for the next five sessions is expected between $1.18 support and $1.42 resistance, with a bearish price bias and less than 20% probability of upside.
Intraday buying contrasts with bearish momentum as volatility rises
Momentum signals on the daily chart remain negative for DOT, with both the MACD and ADX indicating persistent bearish strength. The Relative Strength Index is low at 34, and the Commodity Channel Index is deep in oversold territory, while the Stochastic RSI is neutral, suggesting mixed but generally weak momentum. Bull/Bear Power continues to show seller dominance intraday. Despite DOT's strong rebound today, price action is near the high of the daily range, pointing to increased intraday volatility and renewed buying strength. However, a clear divergence is present between this daily surge and the predominantly bearish, oversold backdrop from oscillators.
Downside risk prevails as oversold conditions cap further gains
Over the next five sessions, DOT will likely trade within a typical volatility band between $1.18 and $1.42 as the oversold condition gradually resolves. The probability of a further price increase remains very low, under 20%, while downside risk prevails. A sustained move above $1.42 could target the next resistance at the Ichimoku Kijun. If DOT drops below $1.18, further declines could occur in line with the ongoing higher timeframe downtrend.
Previously it was reported that Polkadot’s DOT token remains in a protracted downtrend, reflecting sustained capital outflows and diminished speculative activity, with the price consolidating at recent lows following significant volatility. Key technical indicators show trading activity and momentum are subdued, while structural support appears near current levels but upside is capped amid weak recovery signals.


Latest Polkadot News


-
 Afghanistan
-
 Albania
-
 Algeria
-
 Angola
-
 Argentina
-
 Armenia
-
 Australia
-
 Austria
-
 Azerbaijan
-
 Bahamas
-
 Bahrain
-
 Bangladesh
-
 Belarus
-
 Belgium
-
 Bolivia
-
 Botswana
-
 Brazil
-
 Brunei
-
 Bulgaria
-
 Cambodia
-
 Cameroon
-
 Canada
-
 Chile
Chile
-
 China
China
-
 Colombia
-
 Congo
Congo
-
 Costa Rica
-
 Cote d'Ivoire
-
 Croatia
-
 Cuba
Cuba
-
 Cyprus
-
 Czechia
-
 DR Congo
-
 Denmark
-
 Dominican Republic
-
 Ecuador
-
 Egypt
Egypt
-
 El Salvador
-
 Estonia
-
 Eswatini
-
 Ethiopia
-
 Finland
-
 France
-
 Georgia
-
 Germany
-
 Ghana
Ghana
-
 Greece
-
 Haiti
Haiti
-
 Hong Kong
-
 Hungary
-
 India
India
-
 Indonesia
-
 Iran, Islamic republic
-
 Iraq
Iraq
-
 Ireland
-
 Israel
-
 Italy
Italy
-
 Jamaica
-
 Japan
Japan
-
 Jordan
-
 Kazakhstan
-
 Kenya
Kenya
-
 Korea
Korea
-
 Kuwait
-
 Kyrgyzstan
-
 Laos
Laos
-
 Latvia
-
 Lebanon
-
 Lesotho
-
 Libya
Libya
-
 Lithuania
-
 Luxembourg
-
 Madagascar
-
 Malaysia
-
 Malta
Malta
-
 Mauritius
-
 Mexico
-
 Moldova
-
 Mongolia
-
 Montenegro
-
 Morocco
-
 Mozambique
-
 Myanmar
-
 Namibia
-
 Nepal
Nepal
-
 Netherlands
-
 New Zealand
-
 Nigeria
-
 North Macedonia
-
 Norway
-
 Oman
Oman
-
 Pakistan
-
 Palestine
-
 Panama
-
 Papua New Guinea
-
 Paraguay
-
 Peru
Peru
-
 Philippines
-
 Poland
-
 Portugal
-
 Puerto Rico
-
 Qatar
Qatar
-
 Reunion
-
 Romania
-
 Rwanda
-
 Saudi Arabia
-
 Serbia
-
 Singapore
-
 Slovakia
-
 Slovenia
-
 Somalia
-
 South Africa
-
 Spain
Spain
-
 Sri Lanka
-
 Sweden
-
 Switzerland
-
 Syria
Syria
-
 Taiwan
-
 Tajikistan
-
 Tanzania
-
 Thailand
-
 Trinidad and Tobago
-
 Tunisia
-
 Turkey
-
 UAE
UAE
-
 Uganda
-
 Ukraine
-
 United Kingdom
-
United States
-
 Uruguay
-
 Uzbekistan
-
 Venezuela
-
 Vietnam
-
 Yemen
Yemen
-
 Zambia
-
 Zimbabwe
- Forex
- Crypto
