
Hedera price prediction: Will new enterprise adoption power further gains? HBAR rises 7.32%

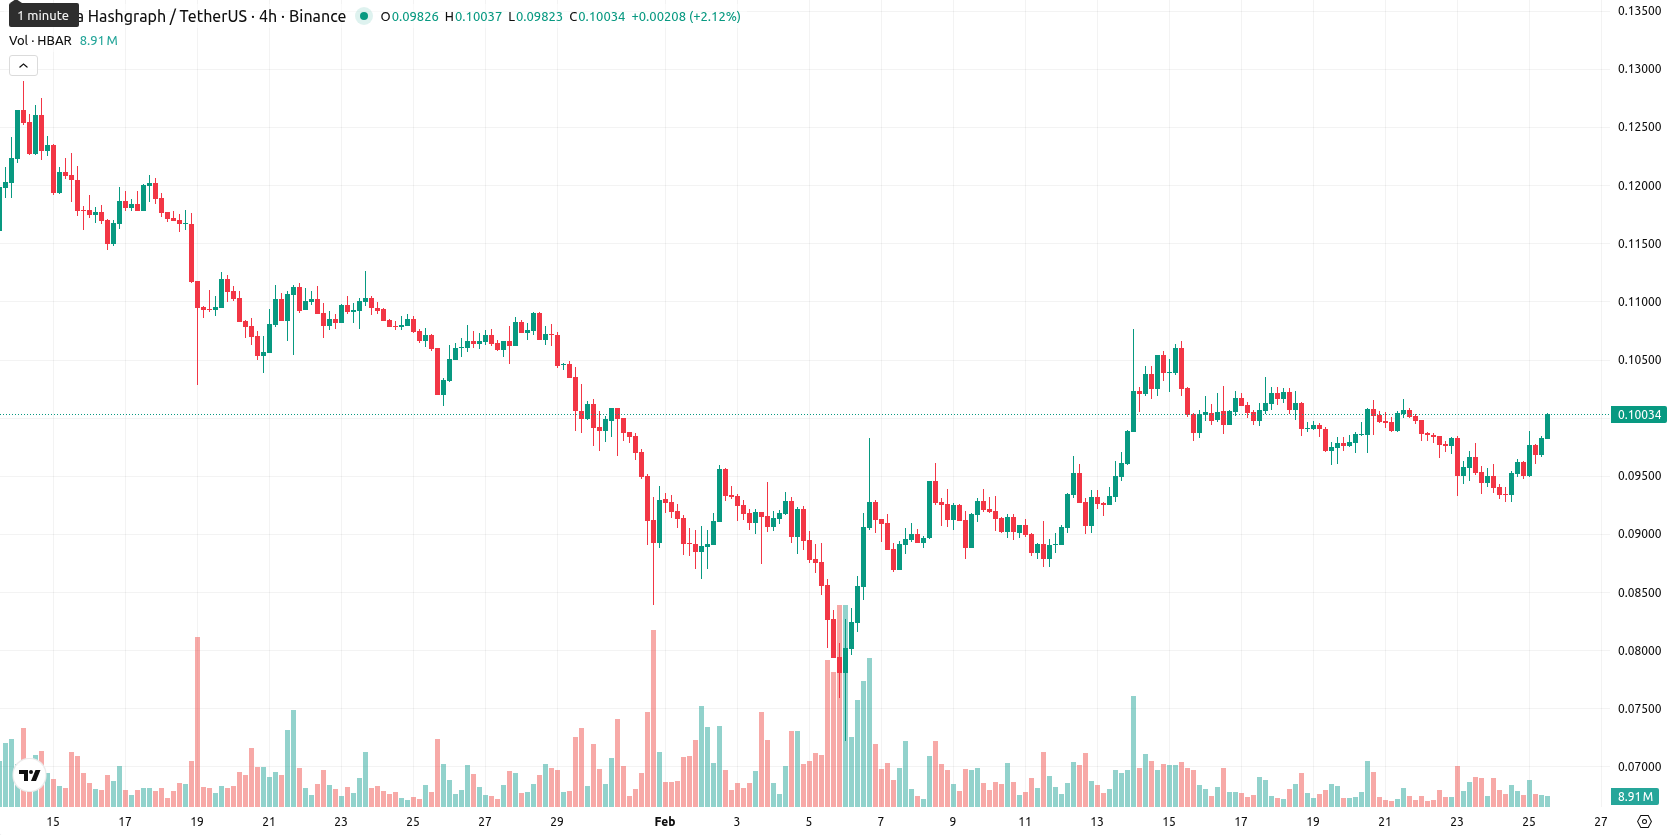
Hedera (HBAR) is trading at $0.10, now above its MA-20 ($0.0954) but still beneath both the MA-50 ($0.1039) and MA-200 ($0.1635). This suggests near-term buyer interest, but medium- and long-term trends remain pressured by sellers, with the Ichimoku Kijun at $0.0899 now acting as immediate support.
Highlights
- The Hashgraph Group launched TrackTrace on February 24, leveraging Hedera’s distributed ledger to enhance global supply chain transparency and EU Digital Product Passport compliance.
- TrackTrace is backed by over 30 Hedera Council members, including Dell, Deutsche Telekom, FedEx, Google, and IBM, strengthening supply chain digital infrastructure amid new regulatory demands.
- HBAR trades at $0.10, above the MA-20 but below MA-50 and MA-200, with strong intraday volatility and a likely sideways range between $0.09–$0.11.
Supply chain solution launch and council backing bolster ecosystem sentiment
On February 24, The Hashgraph Group, part of the Hedera ecosystem, announced the launch of TrackTrace, an enterprise-grade solution aimed at enhancing global supply chain transparency and compliance with the EU's Digital Product Passport regulation. TrackTrace integrates decentralized identity, verifiable credentials, and audit trails using Hedera's distributed ledger, with support from over 30 major organizations in the Hedera Council such as Dell, Deutsche Telekom, FedEx, Google, and IBM. The rollout highlights ongoing efforts within the Hedera ecosystem to address evolving regulatory demands and strengthen supply chain digital infrastructure.
Diverging momentum signals as price volatility rises near highs
Momentum readings are mixed: the MACD signals strong selling, while the ADX indicates weak directional intensity. The RSI is trending lower but not yet oversold, Stochastic RSI and CCI are neutral, and Bull/Bear Power favors sellers, pointing to a lack of clear buyer dominance. The daily change shows HBAR up 7.32%, after a small positive gap at the open, with the price now trading near session highs in a wide range — intraday volatility is high, and today's tone shows strength toward the highs. Divergence persists between some oscillators and momentum indicators, suggesting choppy short-term sentiment.
Range-bound outlook as upside capped and downside bias grows
Looking ahead, the expected five-day range is adjusted to $0.09 – $0.11 to match recent volatility, with both upside and downside capped by medium-term resistance and support. The probability for a price increase in the coming week is very low (less than 20%), making a move lower more likely. The baseline scenario calls for a sideways corridor between $0.09 and $0.11. A bullish scenario would require a decisive break above $0.11, while a bearish turn could see the price testing or dipping below the $0.09 support formed by the Ichimoku Kijun.
Previously it was reported that HBAR trades just above its short-term moving average but remains below longer-term averages, signaling modest support amid persistent selling pressure from technical indicators. Weak momentum, as reflected by the RSI, MACD, and ADX readings, aligns with a projected consolidation within the $0.086–$0.105 range and a mild bearish bias unless key resistance is overcome.


-
 Afghanistan
-
 Albania
-
 Algeria
-
 Angola
-
 Argentina
-
 Armenia
-
 Australia
-
 Austria
-
 Azerbaijan
-
 Bahamas
-
 Bahrain
-
 Bangladesh
-
 Belarus
-
 Belgium
-
 Bolivia
-
 Botswana
-
 Brazil
-
 Brunei
-
 Bulgaria
-
 Cambodia
-
 Cameroon
-
 Canada
-
 Chile
Chile
-
 China
China
-
 Colombia
-
 Congo
Congo
-
 Costa Rica
-
 Cote d'Ivoire
-
 Croatia
-
 Cuba
Cuba
-
 Cyprus
-
 Czechia
-
 DR Congo
-
 Denmark
-
 Dominican Republic
-
 Ecuador
-
 Egypt
Egypt
-
 El Salvador
-
 Estonia
-
 Eswatini
-
 Ethiopia
-
 Finland
-
 France
-
 Georgia
-
 Germany
-
 Ghana
Ghana
-
 Greece
-
 Haiti
Haiti
-
 Hong Kong
-
 Hungary
-
 India
India
-
 Indonesia
-
 Iran, Islamic republic
-
 Iraq
Iraq
-
 Ireland
-
 Israel
-
 Italy
Italy
-
 Jamaica
-
 Japan
Japan
-
 Jordan
-
 Kazakhstan
-
 Kenya
Kenya
-
 Korea
Korea
-
 Kuwait
-
 Kyrgyzstan
-
 Laos
Laos
-
 Latvia
-
 Lebanon
-
 Lesotho
-
 Libya
Libya
-
 Lithuania
-
 Luxembourg
-
 Madagascar
-
 Malaysia
-
 Malta
Malta
-
 Mauritius
-
 Mexico
-
 Moldova
-
 Mongolia
-
 Montenegro
-
 Morocco
-
 Mozambique
-
 Myanmar
-
 Namibia
-
 Nepal
Nepal
-
 Netherlands
-
 New Zealand
-
 Nigeria
-
 North Macedonia
-
 Norway
-
 Oman
Oman
-
 Pakistan
-
 Palestine
-
 Panama
-
 Papua New Guinea
-
 Paraguay
-
 Peru
Peru
-
 Philippines
-
 Poland
-
 Portugal
-
 Puerto Rico
-
 Qatar
Qatar
-
 Reunion
-
 Romania
-
 Rwanda
-
 Saudi Arabia
-
 Serbia
-
 Singapore
-
 Slovakia
-
 Slovenia
-
 Somalia
-
 South Africa
-
 Spain
Spain
-
 Sri Lanka
-
 Sweden
-
 Switzerland
-
 Syria
Syria
-
 Taiwan
-
 Tajikistan
-
 Tanzania
-
 Thailand
-
 Trinidad and Tobago
-
 Tunisia
-
 Turkey
-
 UAE
UAE
-
 Uganda
-
 Ukraine
-
 United Kingdom
-
United States
-
 Uruguay
-
 Uzbekistan
-
 Venezuela
-
 Vietnam
-
 Yemen
Yemen
-
 Zambia
-
 Zimbabwe
- Forex
- Crypto
