
Dogecoin price prediction: Can ETF inflows turn the tide? DOGE jumps 14.85%

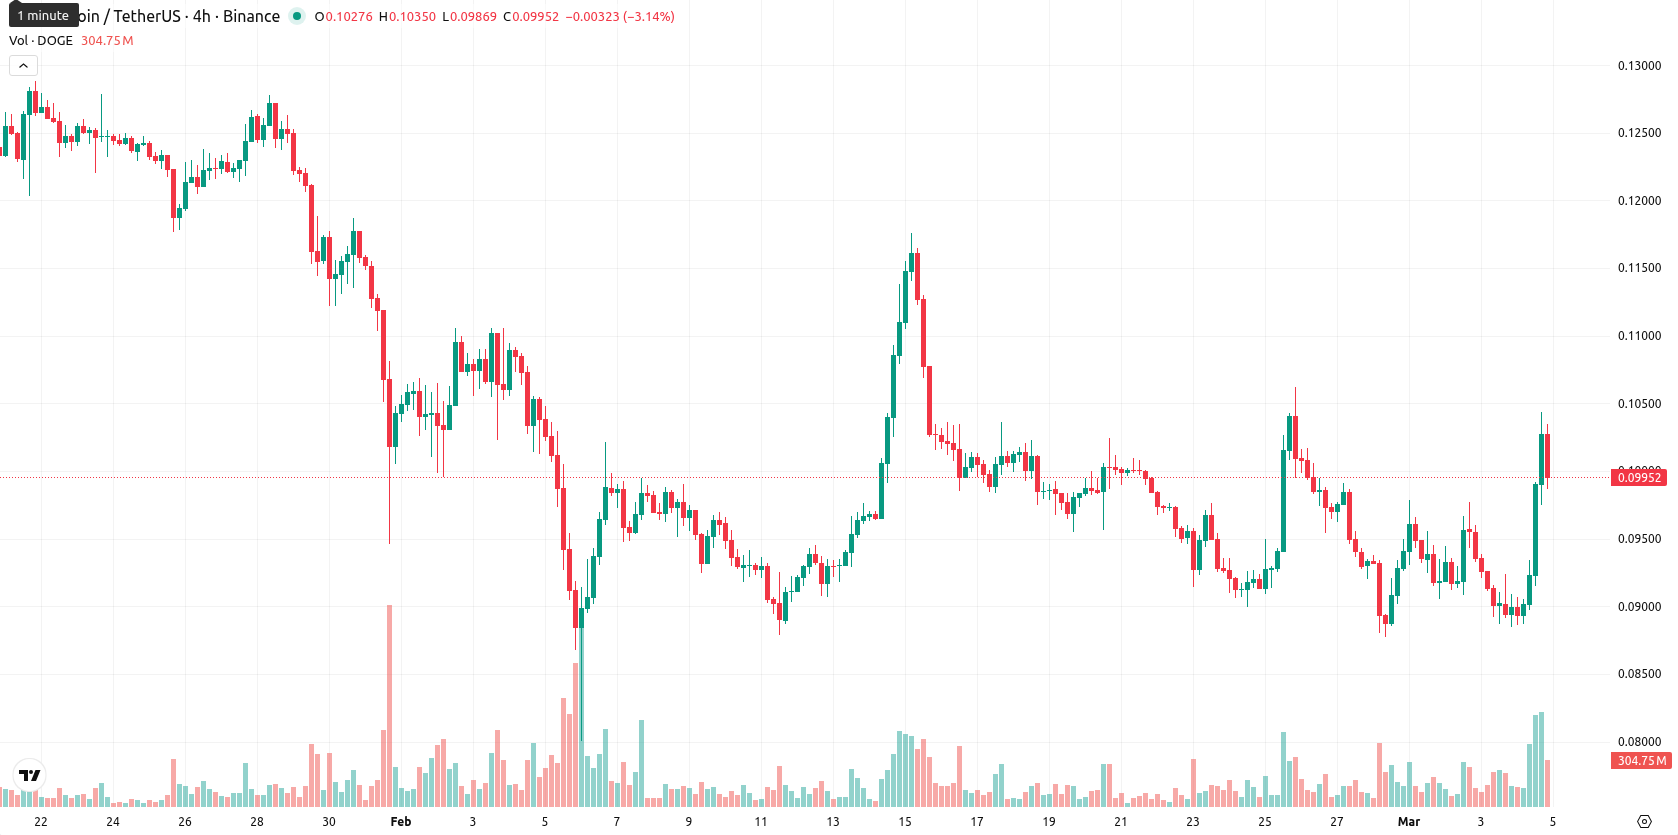
Dogecoin (DOGE) is trading at $0.10194, advancing 14.85% on the day. The price is positioned above its MA-20 ($0.09706) but remains below both the MA-50 ($0.10902) and MA-200 ($0.16809), reflecting a short-term recovery within an overall bearish structure.
Highlights
- The launch of the 21shares Dogecoin ETF (TDOG) on NASDAQ marks the first spot DOGE exposure for public investors.
- TDOG saw renewed inflows of $779,000 after a 30-day pause, lifting total cumulative assets to $7.45 million.
- DOGE trades within a volatile $0.092–$0.112 range as bearish momentum dominates; downside risk prevails unless a sustained move above $0.112 occurs.
ETF inflows resume as spot Dogecoin hits market with new listing
On March 4, 2026, House of Doge partnered with Brag House Holdings and 21shares to celebrate the launch of the 21shares Dogecoin ETF (TDOG) via a NASDAQ bell ringing ceremony, introducing spot Dogecoin exposure to the market. This ETF, which is not registered under the Investment Company Act of 1940, recorded $779,000 in inflows following a 30-day pause, increasing cumulative ETF inflows to approximately $7.45 million. Trading activity data shows Dogecoin continues as one of the largest meme coins by market capitalization, supported by institutional and community initiatives.
Intraday gains diverge from persistent bearish signals across technicals
Technical analysis indicates DOGE is trading above the MA-20 but below both the MA-50 and MA-200, suggesting that short-term momentum has improved even as medium- and long-term trends remain shaped by selling pressure. The Ichimoku Kijun at $0.09879 acts as immediate support, while oscillators such as RSI, Stochastic RSI, and CCI point to a mildly oversold condition. The MACD and ADX maintain a bearish posture on the daily chart, and Bull/Bear Power signals a continued advantage for sellers despite today's strong upward move. Overall, the price is near today's high with elevated volatility, creating a notable divergence between intraday buying and the prevailing bearish momentum on higher timeframes.
Range-bound outlook as upside risk remains limited by weak momentum
Looking ahead, DOGE is expected to trade within a volatility band of $0.092–$0.112 over the next five sessions, tracking recent price action. The probability of a move higher remains low, under 20%, making further downside more likely for now. Consolidation within this range is the baseline scenario; a sustained close above $0.112 could signal a trend reversal, while a break below $0.092 would confirm further bearish momentum.
Last time, analysts noted that Dogecoin remains under significant bearish pressure, trading below all key moving averages with momentum indicators such as MACD and ADX pointing to a continued downtrend, while oscillators confirm that oversold conditions on the daily chart have yet to be triggered. Immediate resistance stands at $0.0988, with a probable sideways consolidation near current levels and elevated downside risk should $0.080 support fail.


-
 Afghanistan
-
 Albania
-
 Algeria
-
 Angola
-
 Argentina
-
 Armenia
-
 Australia
-
 Austria
-
 Azerbaijan
-
 Bahamas
-
 Bahrain
-
 Bangladesh
-
 Belarus
-
 Belgium
-
 Bolivia
-
 Botswana
-
 Brazil
-
 Brunei
-
 Bulgaria
-
 Cambodia
-
 Cameroon
-
 Canada
-
 Chile
Chile
-
 China
China
-
 Colombia
-
 Congo
Congo
-
 Costa Rica
-
 Cote d'Ivoire
-
 Croatia
-
 Cuba
Cuba
-
 Cyprus
-
 Czechia
-
 DR Congo
-
 Denmark
-
 Dominican Republic
-
 Ecuador
-
 Egypt
Egypt
-
 El Salvador
-
 Estonia
-
 Eswatini
-
 Ethiopia
-
 Finland
-
 France
-
 Georgia
-
 Germany
-
 Ghana
Ghana
-
 Greece
-
 Haiti
Haiti
-
 Hong Kong
-
 Hungary
-
 India
India
-
 Indonesia
-
 Iran, Islamic republic
-
 Iraq
Iraq
-
 Ireland
-
 Israel
-
 Italy
Italy
-
 Jamaica
-
 Japan
Japan
-
 Jordan
-
 Kazakhstan
-
 Kenya
Kenya
-
 Korea
Korea
-
 Kuwait
-
 Kyrgyzstan
-
 Laos
Laos
-
 Latvia
-
 Lebanon
-
 Lesotho
-
 Libya
Libya
-
 Lithuania
-
 Luxembourg
-
 Madagascar
-
 Malaysia
-
 Malta
Malta
-
 Mauritius
-
 Mexico
-
 Moldova
-
 Mongolia
-
 Montenegro
-
 Morocco
-
 Mozambique
-
 Myanmar
-
 Namibia
-
 Nepal
Nepal
-
 Netherlands
-
 New Zealand
-
 Nigeria
-
 North Macedonia
-
 Norway
-
 Oman
Oman
-
 Pakistan
-
 Palestine
-
 Panama
-
 Papua New Guinea
-
 Paraguay
-
 Peru
Peru
-
 Philippines
-
 Poland
-
 Portugal
-
 Puerto Rico
-
 Qatar
Qatar
-
 Reunion
-
 Romania
-
 Rwanda
-
 Saudi Arabia
-
 Serbia
-
 Singapore
-
 Slovakia
-
 Slovenia
-
 Somalia
-
 South Africa
-
 Spain
Spain
-
 Sri Lanka
-
 Sweden
-
 Switzerland
-
 Syria
Syria
-
 Taiwan
-
 Tajikistan
-
 Tanzania
-
 Thailand
-
 Trinidad and Tobago
-
 Tunisia
-
 Turkey
-
 UAE
UAE
-
 Uganda
-
 Ukraine
-
 United Kingdom
-
United States
-
 Uruguay
-
 Uzbekistan
-
 Venezuela
-
 Vietnam
-
 Yemen
Yemen
-
 Zambia
-
 Zimbabwe
- Forex
- Crypto
