
Optimism drops 7.17% as network shifts focus from op-geth to op-reth

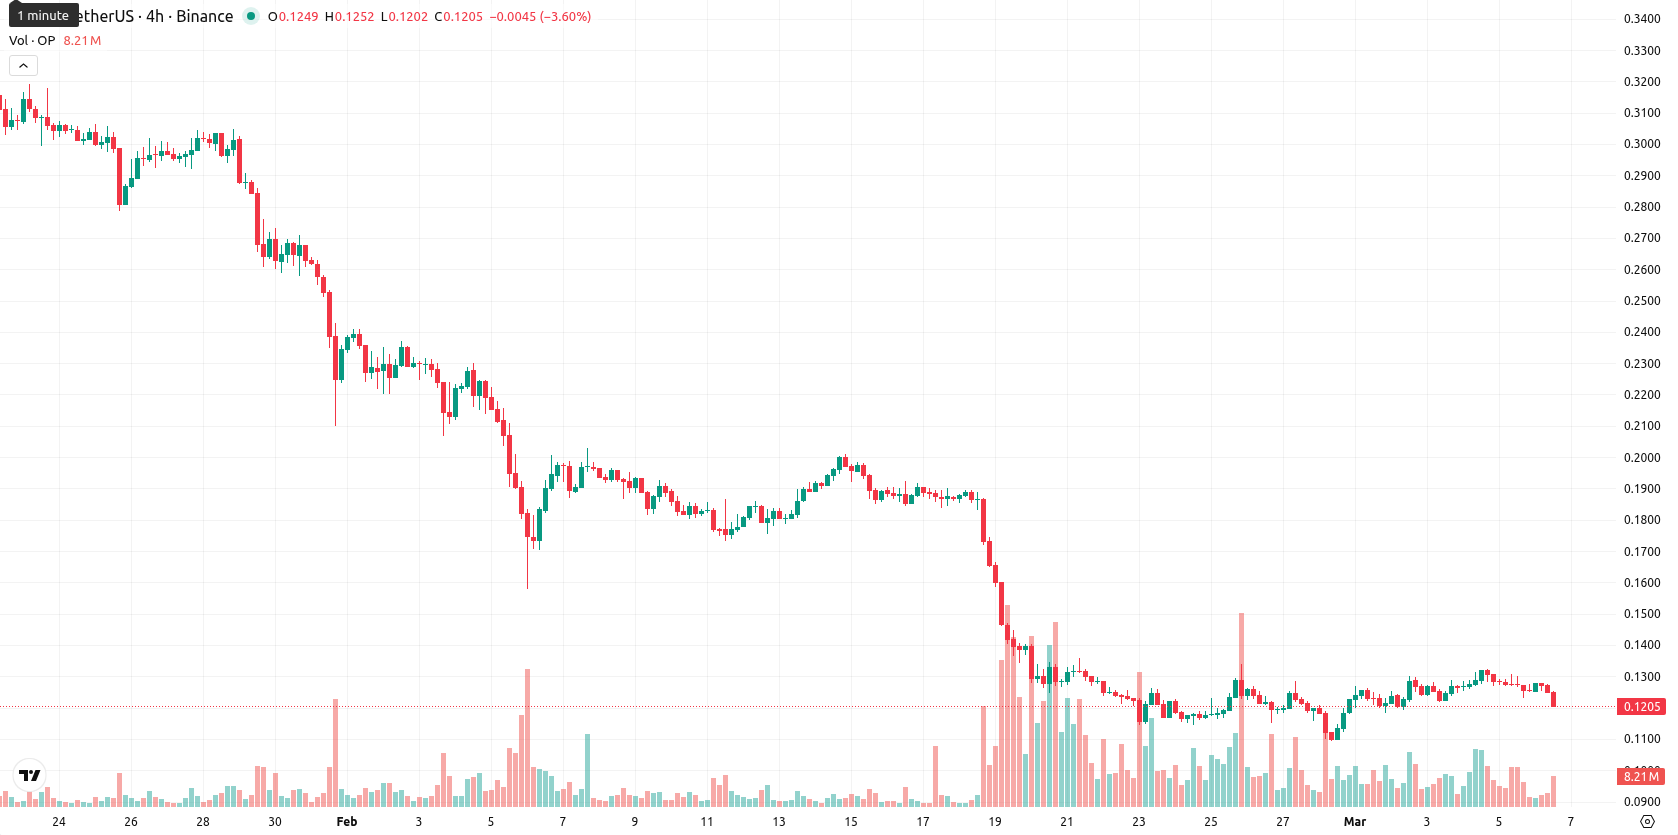
Optimism (OP) is trading at $0.1204, well below the MA-20 at $0.1400, MA-50 at $0.2106, and MA-200 at $0.4182. This reflects a daily loss of 7.17%, with the asset maintaining a position beneath all key moving averages, indicating sustained seller control.
Highlights
- Optimism will discontinue support for op-geth and op-program by May 31, 2026, focusing new development on op-reth and migrating its fault proof system to kona-client.
- This strategic technical shift represents a significant change to the core infrastructure of the Optimism ecosystem.
- OP price remains under heavy selling pressure, trading well below major resistance areas, with a probable range of $0.1100 to $0.1320 and high risk of further declines.
Technical pivot as Optimism retires legacy clients and advances op-reth
Optimism announced it will end support for op-geth and op-program as of May 31, 2026, shifting its development focus to op-reth. The transition will also involve moving the network’s fault proof system to the kona-client. This marks a major technical direction change for the Optimism ecosystem.
Entrenched bearish momentum as indicators confirm high-volume selloff
Momentum remains decisively bearish, with both the MACD and ADX signaling selling pressure. The daily RSI stands deep in oversold territory at 29.65, while Stochastic RSI flags as overbought on the daily chart due to potential signal lag; all lower timeframes show oversold readings. The CCI is neutral but near oversold, and Bull/Bear Power indicates intraday seller dominance, supported by continuous pressure after a high-volatility, directional session. The Ichimoku Kijun at $0.1551 acts as immediate resistance, and the current price is near the lower end of its intraday range, with most momentum indicators confirming strong persistent selling.
Range contraction likely as downtrend persists and bullish risk fades
Looking ahead, the adjusted weekly price range for OP is expected between $0.1100 and $0.1320, capturing typical volatility while maintaining alignment with the current downtrend. There is a very low probability (less than 20%) of a meaningful price increase in the next 5 trading days, as all major weekly trend and momentum indicators continue to confirm downward bias. The baseline scenario points to sideways movement within this lower volatility band, with a bullish scenario only arising if the price breaks above the Ichimoku Kijun at $0.1551 and a bearish extension likely if support at $0.1100 fails.
Previously it was reported that Optimism remains in a sustained bearish trend, trading well below all major moving averages with oversold momentum indicated by weekly RSI, MACD, and other oscillators. Immediate resistance sits near the Ichimoku Kijun, while the absence of strong weekly support and persistent seller dominance suggest further downside or consolidation is likely in the coming week.


Latest Optimism News


-
 Afghanistan
-
 Albania
-
 Algeria
-
 Angola
-
 Argentina
-
 Armenia
-
 Australia
-
 Austria
-
 Azerbaijan
-
 Bahamas
-
 Bahrain
-
 Bangladesh
-
 Belarus
-
 Belgium
-
 Bolivia
-
 Botswana
-
 Brazil
-
 Brunei
-
 Bulgaria
-
 Cambodia
-
 Cameroon
-
 Canada
-
 Chile
Chile
-
 China
China
-
 Colombia
-
 Congo
Congo
-
 Costa Rica
-
 Cote d'Ivoire
-
 Croatia
-
 Cuba
Cuba
-
 Cyprus
-
 Czechia
-
 DR Congo
-
 Denmark
-
 Dominican Republic
-
 Ecuador
-
 Egypt
Egypt
-
 El Salvador
-
 Estonia
-
 Eswatini
-
 Ethiopia
-
 Finland
-
 France
-
 Georgia
-
 Germany
-
 Ghana
Ghana
-
 Greece
-
 Haiti
Haiti
-
 Hong Kong
-
 Hungary
-
 India
India
-
 Indonesia
-
 Iran, Islamic republic
-
 Iraq
Iraq
-
 Ireland
-
 Israel
-
 Italy
Italy
-
 Jamaica
-
 Japan
Japan
-
 Jordan
-
 Kazakhstan
-
 Kenya
Kenya
-
 Korea
Korea
-
 Kuwait
-
 Kyrgyzstan
-
 Laos
Laos
-
 Latvia
-
 Lebanon
-
 Lesotho
-
 Libya
Libya
-
 Lithuania
-
 Luxembourg
-
 Madagascar
-
 Malaysia
-
 Malta
Malta
-
 Mauritius
-
 Mexico
-
 Moldova
-
 Mongolia
-
 Montenegro
-
 Morocco
-
 Mozambique
-
 Myanmar
-
 Namibia
-
 Nepal
Nepal
-
 Netherlands
-
 New Zealand
-
 Nigeria
-
 North Macedonia
-
 Norway
-
 Oman
Oman
-
 Pakistan
-
 Palestine
-
 Panama
-
 Papua New Guinea
-
 Paraguay
-
 Peru
Peru
-
 Philippines
-
 Poland
-
 Portugal
-
 Puerto Rico
-
 Qatar
Qatar
-
 Reunion
-
 Romania
-
 Rwanda
-
 Saudi Arabia
-
 Serbia
-
 Singapore
-
 Slovakia
-
 Slovenia
-
 Somalia
-
 South Africa
-
 Spain
Spain
-
 Sri Lanka
-
 Sweden
-
 Switzerland
-
 Syria
Syria
-
 Taiwan
-
 Tajikistan
-
 Tanzania
-
 Thailand
-
 Trinidad and Tobago
-
 Tunisia
-
 Turkey
-
 UAE
UAE
-
 Uganda
-
 Ukraine
-
 United Kingdom
-
United States
-
 Uruguay
-
 Uzbekistan
-
 Venezuela
-
 Vietnam
-
 Yemen
Yemen
-
 Zambia
-
 Zimbabwe
- Forex
- Crypto
