
Optimism climbs 4.05% as intraday buyers hold control

Optimism (OP) is trading at $0.0976, up 4.05% on the day. The price currently sits above its key short- and medium-term moving averages.
Highlights
- Short- and medium-term momentum remains positive with price trading above key moving averages, despite a bearish long-term trend.
- Momentum indicators signal strong buy sentiment, but mixed oscillator readings reflect ongoing uncertainty over short-term trend strength.
- Expected trading range for the next 2–3 days is $0.0828 to $0.1004, with a 70% probability of an upward move.
Mixed momentum signals as buyers test immediate support
On the hourly chart, OP is trading above the MA-20 ($0.0953) and MA-50 ($0.0942), while the daily timeframe shows the price well below the MA-200 ($0.1913). The Ichimoku Kijun at $0.0950 serves as immediate support. The MACD indicator points to strong buy momentum and BBP also favors intraday buyer dominance, while ADX and AO remain neutral, signaling no clear trend strength at this stage. RSI is at 52.874 with a Buy signal, Stoch RSI is oversold, and CCI is neutral, indicating mixed momentum signals near the high of today's range and against a backdrop of moderate volatility.
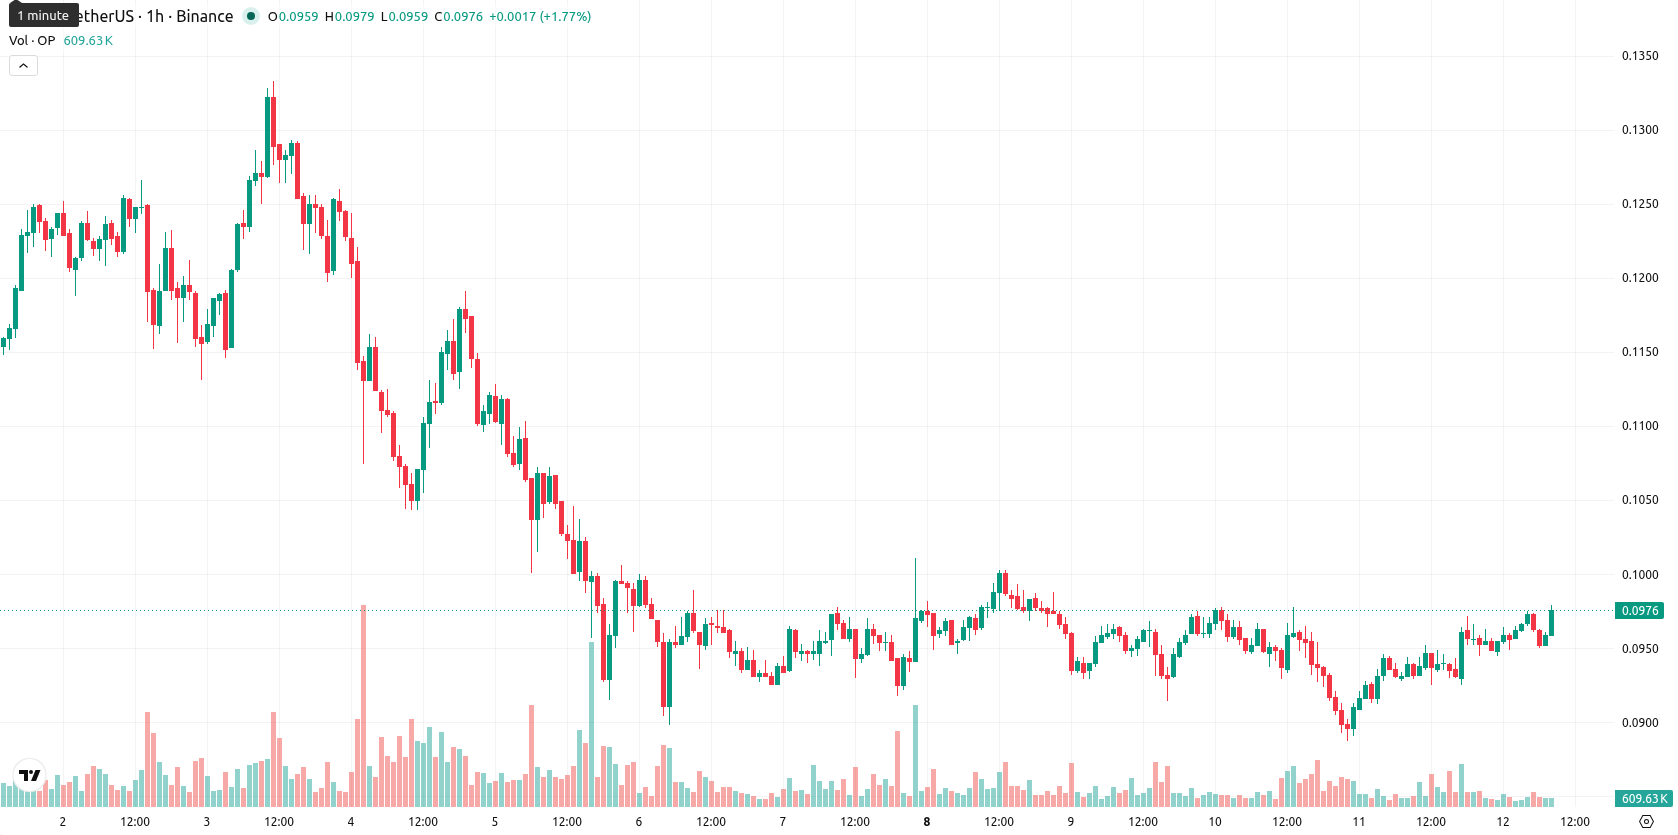
Bullish bias as consolidation precedes resistance test
Over the next 2–3 trading days, OP is expected to consolidate within a typical volatility band ranging from $0.0828 to $0.1004. The probability of an upward move toward the upper end of this range stands at 70%, while the likelihood of a downside scenario is 30%. If resistance is broken, a bullish scenario may unfold with price testing the upper boundary; conversely, breaking below immediate support at $0.0950 could trigger a move towards the lower end of the range.
Earlier, analysts noted that sustained bearish momentum and prevailing negative signals were limiting Optimism’s upside potential. However, the latest price action and intraday indicator dynamics suggest renewed buyer interest, so market participants should closely monitor the interplay between $0.0950 support and $0.1004 resistance as potential catalysts for the next directional move.


Latest Optimism News


-
 Afghanistan
-
 Albania
-
 Algeria
-
 Angola
-
 Argentina
-
 Armenia
-
 Australia
-
 Austria
-
 Azerbaijan
-
 Bahamas
-
 Bahrain
-
 Bangladesh
-
 Belarus
-
 Belgium
-
 Bolivia
-
 Botswana
-
 Brazil
-
 Brunei
-
 Bulgaria
-
 Cambodia
-
 Cameroon
-
 Canada
-
 Chile
Chile
-
 China
China
-
 Colombia
-
 Congo
Congo
-
 Costa Rica
-
 Cote d'Ivoire
-
 Croatia
-
 Cuba
Cuba
-
 Cyprus
-
 Czechia
-
 DR Congo
-
 Denmark
-
 Dominican Republic
-
 Ecuador
-
 Egypt
Egypt
-
 El Salvador
-
 Estonia
-
 Eswatini
-
 Ethiopia
-
 Finland
-
 France
-
 Georgia
-
 Germany
-
 Ghana
Ghana
-
 Greece
-
 Haiti
Haiti
-
 Hong Kong
-
 Hungary
-
 India
India
-
 Indonesia
-
 Iran, Islamic republic
-
 Iraq
Iraq
-
 Ireland
-
 Israel
-
 Italy
Italy
-
 Jamaica
-
 Japan
Japan
-
 Jordan
-
 Kazakhstan
-
 Kenya
Kenya
-
 Korea
Korea
-
 Kuwait
-
 Kyrgyzstan
-
 Laos
Laos
-
 Latvia
-
 Lebanon
-
 Lesotho
-
 Libya
Libya
-
 Lithuania
-
 Luxembourg
-
 Madagascar
-
 Malaysia
-
 Malta
Malta
-
 Mauritius
-
 Mexico
-
 Moldova
-
 Mongolia
-
 Montenegro
-
 Morocco
-
 Mozambique
-
 Myanmar
-
 Namibia
-
 Nepal
Nepal
-
 Netherlands
-
 New Zealand
-
 Nigeria
-
 North Macedonia
-
 Norway
-
 Oman
Oman
-
 Pakistan
-
 Palestine
-
 Panama
-
 Papua New Guinea
-
 Paraguay
-
 Peru
Peru
-
 Philippines
-
 Poland
-
 Portugal
-
 Puerto Rico
-
 Qatar
Qatar
-
 Reunion
-
 Romania
-
 Rwanda
-
 Saudi Arabia
-
 Serbia
-
 Singapore
-
 Slovakia
-
 Slovenia
-
 Somalia
-
 South Africa
-
 Spain
Spain
-
 Sri Lanka
-
 Sweden
-
 Switzerland
-
 Syria
Syria
-
 Taiwan
-
 Tajikistan
-
 Tanzania
-
 Thailand
-
 Trinidad and Tobago
-
 Tunisia
-
 Turkey
-
 UAE
UAE
-
 Uganda
-
 Ukraine
-
 United Kingdom
-
United States
-
 Uruguay
-
 Uzbekistan
-
 Venezuela
-
 Vietnam
-
 Yemen
Yemen
-
 Zambia
-
 Zimbabwe
- Forex
- Crypto
