
Polygon slide 5.90% with downside dominated by negative MACD signals – weekly forecast

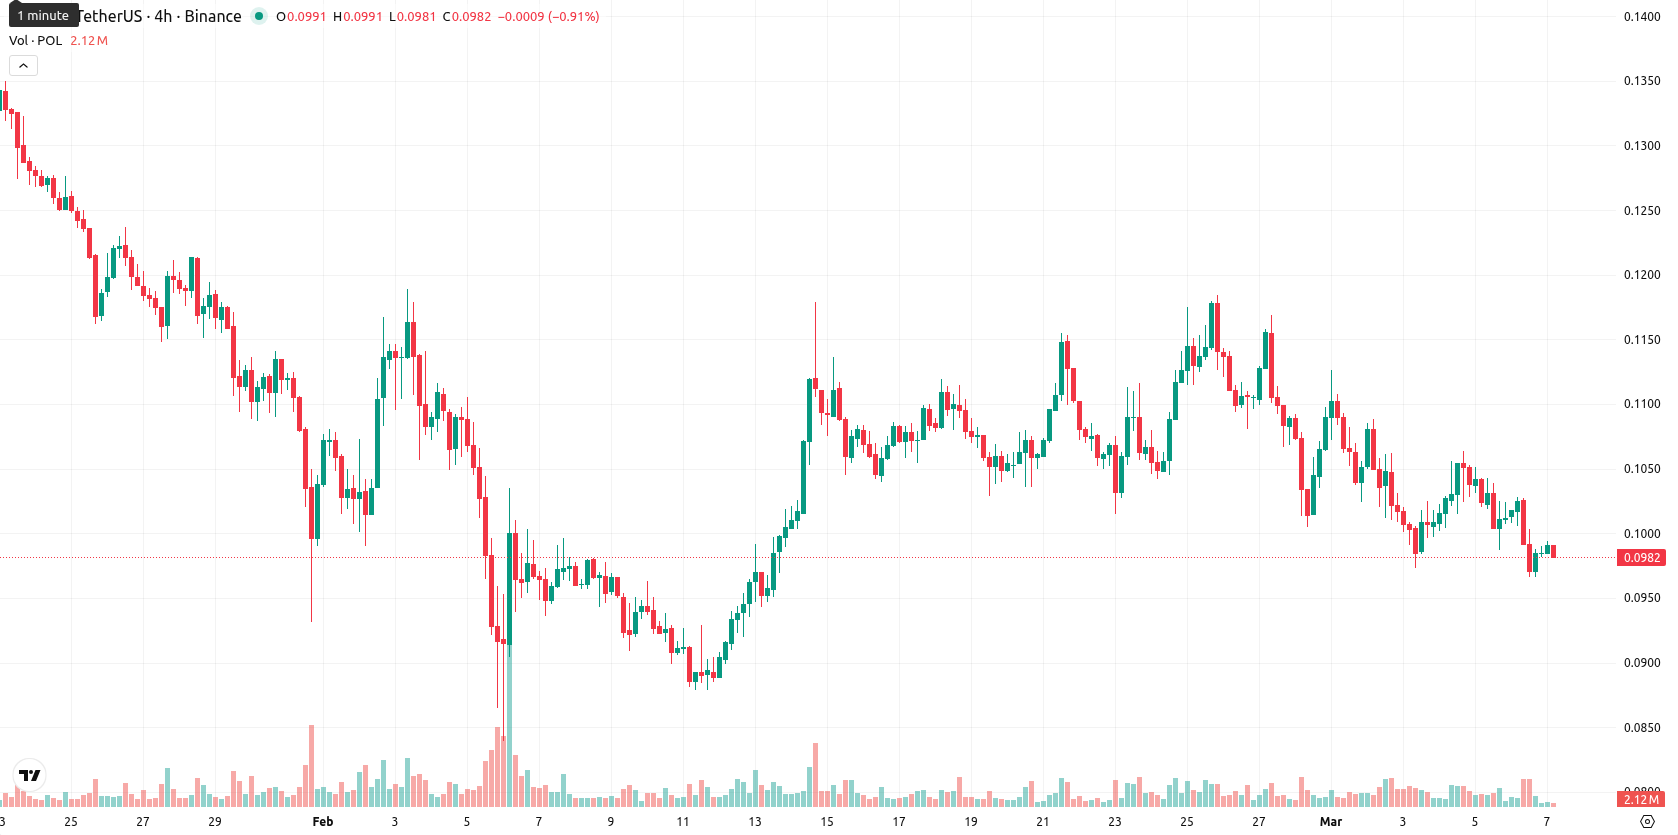
Polygon (POL, formerly MATIC) closed the week at $0.0987, down 5.90% over the past seven days and stuck firmly below both the weekly MA-20 ($0.1301) and MA-50 ($0.1864). This persistent weakness highlights sustained bearish momentum as the price remains at the bottom of its recent range, under strong dynamic resistance from the MA-20.
Highlights
- POL sustains a strong bearish trend, trading well below its key moving averages and facing persistent seller pressure.
- Momentum indicators confirm downside risk, with no current buy signals and the market showing bearish or oversold characteristics.
- POL is expected to consolidate between $0.0892 and $0.1082; a break below $0.0892 may intensify the downward move.
Ecosystem expansion and protocol upgrades shape sentiment this week
Polygon’s transition from a single scaling chain to a multi-chain ecosystem continues, with the rollout of Polygon 2.0, expanded zkEVM adoption, and ongoing infrastructure enhancements supporting its growth. The native POL token now covers broader network functions, including staking, governance, and ecosystem participation. These developments underscore the project’s focus on Ethereum compatibility and cross-chain building.
Technical indicators reinforce bearish structure and downside risks over the week
Weekly technical analysis for POL remains bearish, as the asset trades well below key moving averages (MA-20 at $0.1301 and MA-50 at $0.1864), with the MA-20 acting as immediate resistance. Downside momentum dominates, confirmed by negative MACD and weak ADX signals, while both RSI and Stochastic RSI indicate oversold or bearish conditions. CCI is deep in sell territory, Bull/Bear Power signals clear seller strength, and the Awesome Oscillator is neutral. Weekly volatility for POL is elevated at 16.56%, and the price has settled at the lower end of its recent zone, signaling strong downward pressure and lack of bullish triggers.
Limited rebound prospects as weak signals define next week’s range
For the next week, the forecast range for POL is $0.0892 to $0.1082, aligning with recent volatility and technical pressure. The probability of a price increase remains low (less than 20%), as none of the momentum indicators suggest a bullish reversal. The baseline outlook anticipates consolidation within this range. A decisive break above $0.1082 could signal the start of a recovery, while a drop below $0.0892 would reinforce the ongoing downtrend.
Previously it was reported that speculation on Polymarket linked to George Cottrell suffered substantial losses on Iran-related and UK Prime Minister bets, raising questions about the platform’s transparency and regulatory oversight. The controversy has highlighted increased volatility and potential downside risks in prediction markets, with price trends now vulnerable to scrutiny around insider activity and regulatory intervention, while technical indicators suggest uncertain momentum as support and resistance levels remain undefined amid ongoing investigations.


-
 Afghanistan
-
 Albania
-
 Algeria
-
 Angola
-
 Argentina
-
 Armenia
-
 Australia
-
 Austria
-
 Azerbaijan
-
 Bahamas
-
 Bahrain
-
 Bangladesh
-
 Belarus
-
 Belgium
-
 Bolivia
-
 Botswana
-
 Brazil
-
 Brunei
-
 Bulgaria
-
 Cambodia
-
 Cameroon
-
 Canada
-
 Chile
Chile
-
 China
China
-
 Colombia
-
 Congo
Congo
-
 Costa Rica
-
 Cote d'Ivoire
-
 Croatia
-
 Cuba
Cuba
-
 Cyprus
-
 Czechia
-
 DR Congo
-
 Denmark
-
 Dominican Republic
-
 Ecuador
-
 Egypt
Egypt
-
 El Salvador
-
 Estonia
-
 Eswatini
-
 Ethiopia
-
 Finland
-
 France
-
 Georgia
-
 Germany
-
 Ghana
Ghana
-
 Greece
-
 Haiti
Haiti
-
 Hong Kong
-
 Hungary
-
 India
India
-
 Indonesia
-
 Iran, Islamic republic
-
 Iraq
Iraq
-
 Ireland
-
 Israel
-
 Italy
Italy
-
 Jamaica
-
 Japan
Japan
-
 Jordan
-
 Kazakhstan
-
 Kenya
Kenya
-
 Korea
Korea
-
 Kuwait
-
 Kyrgyzstan
-
 Laos
Laos
-
 Latvia
-
 Lebanon
-
 Lesotho
-
 Libya
Libya
-
 Lithuania
-
 Luxembourg
-
 Madagascar
-
 Malaysia
-
 Malta
Malta
-
 Mauritius
-
 Mexico
-
 Moldova
-
 Mongolia
-
 Montenegro
-
 Morocco
-
 Mozambique
-
 Myanmar
-
 Namibia
-
 Nepal
Nepal
-
 Netherlands
-
 New Zealand
-
 Nigeria
-
 North Macedonia
-
 Norway
-
 Oman
Oman
-
 Pakistan
-
 Palestine
-
 Panama
-
 Papua New Guinea
-
 Paraguay
-
 Peru
Peru
-
 Philippines
-
 Poland
-
 Portugal
-
 Puerto Rico
-
 Qatar
Qatar
-
 Reunion
-
 Romania
-
 Rwanda
-
 Saudi Arabia
-
 Serbia
-
 Singapore
-
 Slovakia
-
 Slovenia
-
 Somalia
-
 South Africa
-
 Spain
Spain
-
 Sri Lanka
-
 Sweden
-
 Switzerland
-
 Syria
Syria
-
 Taiwan
-
 Tajikistan
-
 Tanzania
-
 Thailand
-
 Trinidad and Tobago
-
 Tunisia
-
 Turkey
-
 UAE
UAE
-
 Uganda
-
 Ukraine
-
 United Kingdom
-
United States
-
 Uruguay
-
 Uzbekistan
-
 Venezuela
-
 Vietnam
-
 Yemen
Yemen
-
 Zambia
-
 Zimbabwe
- Forex
- Crypto
