
GRT advances modestly as technical momentum stays firmly bearish – weekly analysis

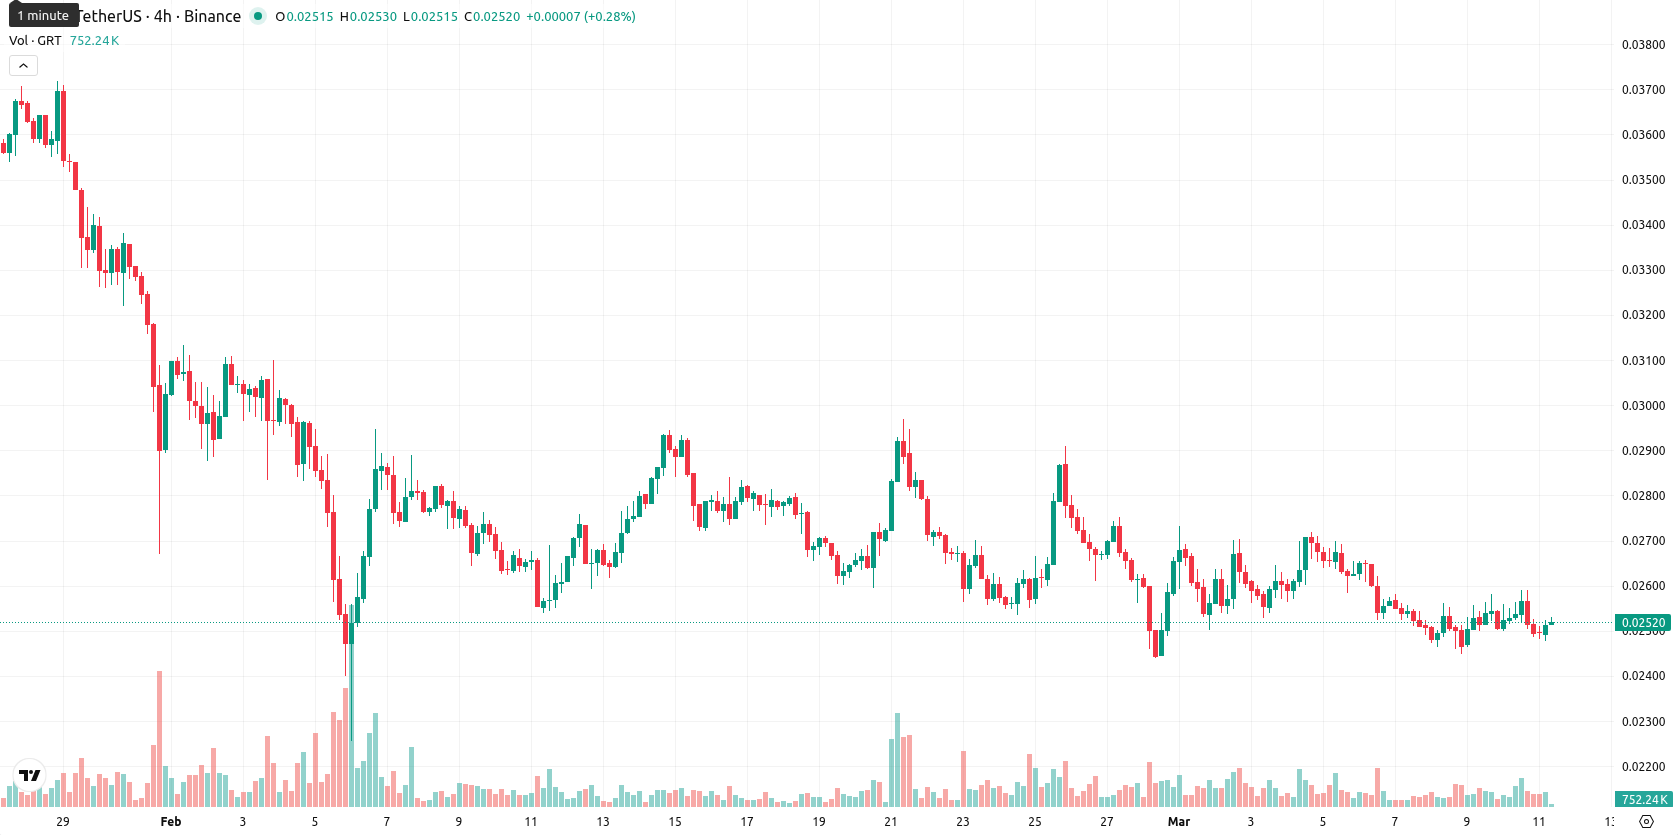
The Graph (GRT) closed the week at $0.02519, recording a modest recovery of 2.34% from the previous week while remaining deep in the lower end of its seven-day trading range. The asset continues to trade well below its weekly MA-20 ($0.03953880), MA-50 ($0.07023452), and MA-200 ($0.13403263), reinforcing ongoing medium- and long-term bearish momentum.
Highlights
- GRT trades well below key moving averages, reflecting sustained bearish pressure across both medium- and long-term trends.
- All major momentum and oscillator indicators signal weak sentiment, with selling bias dominant and no bullish signals present.
- Price is forecast to move sideways between $0.02300 and $0.02780, with a high probability of further downside if $0.02300 breaks.
Persistent downside signals as technicals confirm heightened volatility this week
Technical analysis on the weekly timeframe highlights significant downward pressure, as GRT stays below all key moving averages. The nearest resistance is at MA-20, while no strong dynamic support is found nearby. Weekly indicators reinforce a bearish stance: the MACD and ADX both indicate selling conditions, the RSI shows deep oversold readings, Stochastic RSI remains oversold, CCI points to a sell bias, and Bull/Bear Power confirms seller dominance. Notably, no bullish signals are present and the Awesome Oscillator remains neutral, despite heightened volatility at 10.25%.
Sideways bias favored for next week amid low breakout probability
Looking ahead, GRT is forecast to trade between $0.02300 and $0.02780, reflecting typical weekly volatility. Technical momentum suggests a low probability (less than 20%) of any sustained upside, with key indicators showing no buy signals. The base case expects sideways movement within the current range. A sustained break below $0.02300 would likely extend the bearish trend further, while a close above $0.02780 is unlikely under current conditions.
Previously it was reported that The Graph remains entrenched in bearish territory, with the price anchored below all major moving averages and weekly indicators such as RSI and MACD signaling sustained negative momentum. Over the next week, analysts expect GRT to remain rangebound between its established support and resistance levels, with little probability of a meaningful upward reversal unless a decisive close above resistance occurs.


-
 Afghanistan
-
 Albania
-
 Algeria
-
 Angola
-
 Argentina
-
 Armenia
-
 Australia
-
 Austria
-
 Azerbaijan
-
 Bahamas
-
 Bahrain
-
 Bangladesh
-
 Belarus
-
 Belgium
-
 Bolivia
-
 Botswana
-
 Brazil
-
 Brunei
-
 Bulgaria
-
 Cambodia
-
 Cameroon
-
 Canada
-
 Chile
Chile
-
 China
China
-
 Colombia
-
 Congo
Congo
-
 Costa Rica
-
 Cote d'Ivoire
-
 Croatia
-
 Cuba
Cuba
-
 Cyprus
-
 Czechia
-
 DR Congo
-
 Denmark
-
 Dominican Republic
-
 Ecuador
-
 Egypt
Egypt
-
 El Salvador
-
 Estonia
-
 Eswatini
-
 Ethiopia
-
 Finland
-
 France
-
 Georgia
-
 Germany
-
 Ghana
Ghana
-
 Greece
-
 Haiti
Haiti
-
 Hong Kong
-
 Hungary
-
 India
India
-
 Indonesia
-
 Iran, Islamic republic
-
 Iraq
Iraq
-
 Ireland
-
 Israel
-
 Italy
Italy
-
 Jamaica
-
 Japan
Japan
-
 Jordan
-
 Kazakhstan
-
 Kenya
Kenya
-
 Korea
Korea
-
 Kuwait
-
 Kyrgyzstan
-
 Laos
Laos
-
 Latvia
-
 Lebanon
-
 Lesotho
-
 Libya
Libya
-
 Lithuania
-
 Luxembourg
-
 Madagascar
-
 Malaysia
-
 Malta
Malta
-
 Mauritius
-
 Mexico
-
 Moldova
-
 Mongolia
-
 Montenegro
-
 Morocco
-
 Mozambique
-
 Myanmar
-
 Namibia
-
 Nepal
Nepal
-
 Netherlands
-
 New Zealand
-
 Nigeria
-
 North Macedonia
-
 Norway
-
 Oman
Oman
-
 Pakistan
-
 Palestine
-
 Panama
-
 Papua New Guinea
-
 Paraguay
-
 Peru
Peru
-
 Philippines
-
 Poland
-
 Portugal
-
 Puerto Rico
-
 Qatar
Qatar
-
 Reunion
-
 Romania
-
 Rwanda
-
 Saudi Arabia
-
 Serbia
-
 Singapore
-
 Slovakia
-
 Slovenia
-
 Somalia
-
 South Africa
-
 Spain
Spain
-
 Sri Lanka
-
 Sweden
-
 Switzerland
-
 Syria
Syria
-
 Taiwan
-
 Tajikistan
-
 Tanzania
-
 Thailand
-
 Trinidad and Tobago
-
 Tunisia
-
 Turkey
-
 UAE
UAE
-
 Uganda
-
 Ukraine
-
 United Kingdom
-
United States
-
 Uruguay
-
 Uzbekistan
-
 Venezuela
-
 Vietnam
-
 Yemen
Yemen
-
 Zambia
-
 Zimbabwe
- Forex
- Crypto
