
GRT faces extended selling pressure amid low RSI and neutral oscillators, locking price into a tight range – weekly report

The Graph (GRT) is currently priced at $0.025792, showing a modest gain of 0.74% over the last seven days. Despite this slight uptick, GRT remains well beneath its weekly MA-20 ($0.04168250), MA-50 ($0.07154380), and MA-200 ($0.13491345), underscoring sustained selling pressure and a positioning deep in bearish territory.
 0.01684
0.01798000
0.01684
0.01798000
Highlights
- GRT is trading at $0.025792, significantly below weekly MA-20, MA-50, and MA-200, indicating persistent medium- and long-term bearish pressure.
- Momentum signals on the weekly chart remain strongly negative, with MACD, ADX, and oscillators confirming oversold conditions and ongoing seller dominance.
- Expected 7-day range is $0.0232–$0.0283, with less than 20% probability of a sustained move higher and no confirmed bullish reversal signals.
Momentum remains negative over the week amid extended oversold signals
Technical indicators on the weekly timeframe remain clearly negative, with the price anchored below all major moving averages. Weekly support is found at $0.0232, while resistance lies at $0.0283. The RSI on W1 sits at 26.44, deep in oversold territory, while Stochastic RSI (8.95) and Commodity Channel Index (–101.25) confirm that selling is extended. Both the MACD and ADX describe a robust bearish trend, while Bull/Bear Power is negative and the Awesome Oscillator is neutral, providing no signs of a reversal.
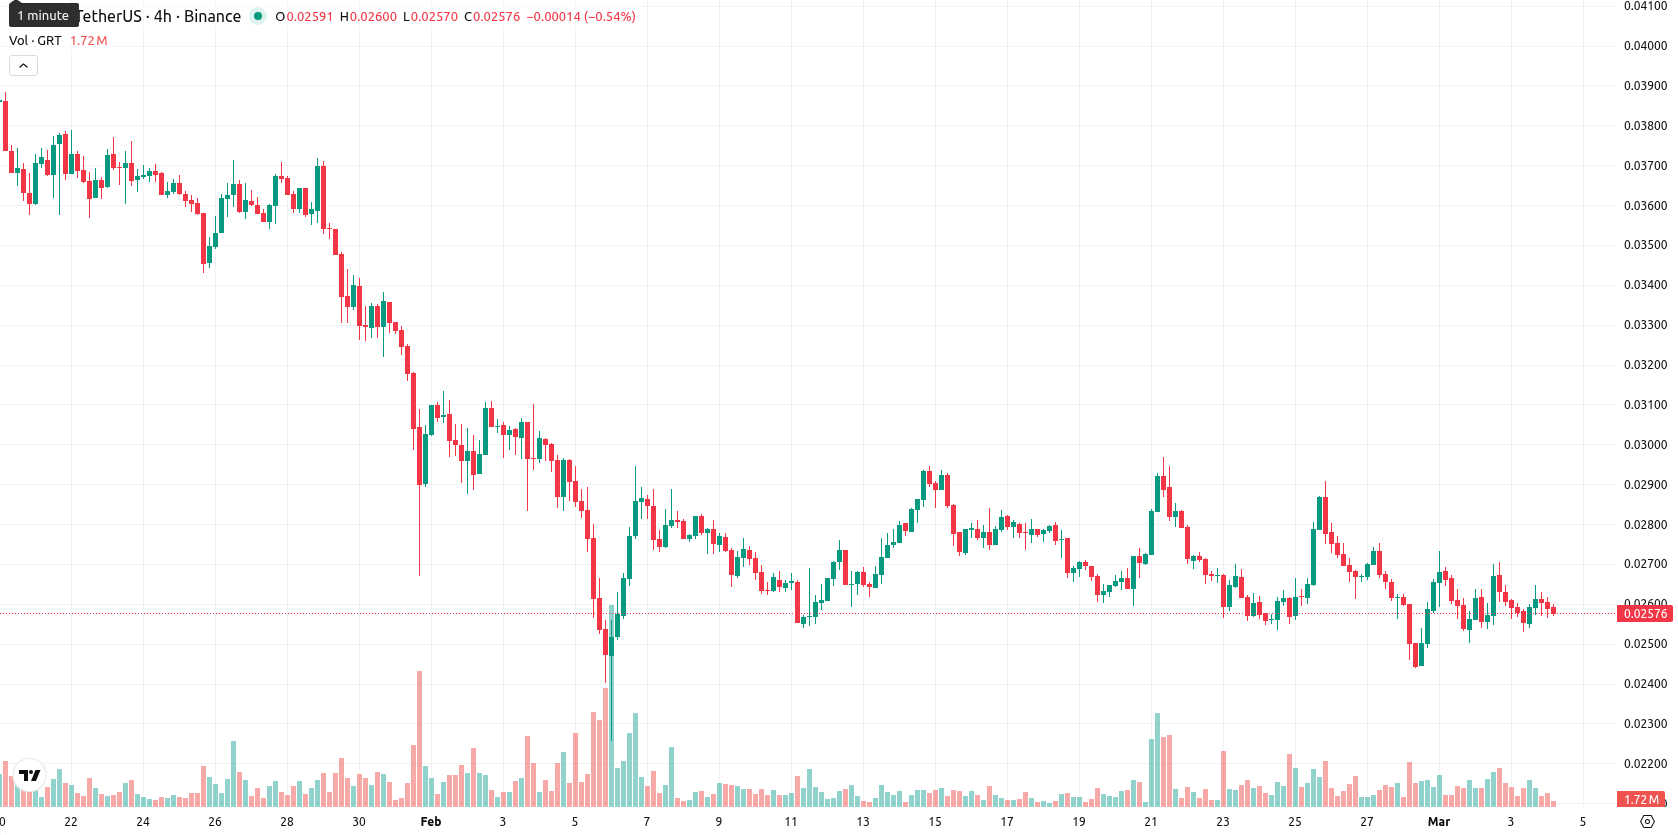
Rangebound price action projected as bearish momentum persists next week
Over the coming 5–7 trading days, GRT is expected to remain confined between $0.0232 and $0.0283, with momentum and trend signals pointing to an increased risk of further downside. There is less than a 20% probability of a sustained upward move given that none of the four key technical signals are on Buy or Strong Buy. Sideways price action within this range remains the most likely outcome, as oversold oscillators limit immediate downside but fail to deliver bullish confirmation. Only a decisive weekly close above $0.0283 would trigger initial signs of reversal, while further weakness could see GRT test the lower boundary near $0.0232.
Previously it was reported that The Graph remains under strong selling pressure, trading below key moving averages, with negative momentum confirmed by MACD, ADX, and low RSI values on both daily and weekly timeframes. Immediate resistance is observed at the Ichimoku Kijun, and with all major technical indicators pointing to a persistent bearish trend, further downside risk is expected unless a clear reversal emerges.









-
 Afghanistan
-
 Albania
-
 Algeria
-
 Angola
-
 Argentina
-
 Armenia
-
 Australia
-
 Austria
-
 Azerbaijan
-
 Bahamas
-
 Bahrain
-
 Bangladesh
-
 Belarus
-
 Belgium
-
 Bolivia
-
 Botswana
-
 Brazil
-
 Brunei
-
 Bulgaria
-
 Cambodia
-
 Cameroon
-
 Canada
-
 Chile
Chile
-
 China
China
-
 Colombia
-
 Congo
Congo
-
 Costa Rica
-
 Cote d'Ivoire
-
 Croatia
-
 Cuba
Cuba
-
 Cyprus
-
 Czechia
-
 DR Congo
-
 Denmark
-
 Dominican Republic
-
 Ecuador
-
 Egypt
Egypt
-
 El Salvador
-
 Estonia
-
 Eswatini
-
 Ethiopia
-
 Finland
-
 France
-
 Georgia
-
 Germany
-
 Ghana
Ghana
-
 Greece
-
 Haiti
Haiti
-
 Hong Kong
-
 Hungary
-
 India
India
-
 Indonesia
-
 Iran, Islamic republic
-
 Iraq
Iraq
-
 Ireland
-
 Israel
-
 Italy
Italy
-
 Jamaica
-
 Japan
Japan
-
 Jordan
-
 Kazakhstan
-
 Kenya
Kenya
-
 Korea
Korea
-
 Kuwait
-
 Kyrgyzstan
-
 Laos
Laos
-
 Latvia
-
 Lebanon
-
 Lesotho
-
 Libya
Libya
-
 Lithuania
-
 Luxembourg
-
 Madagascar
-
 Malaysia
-
 Malta
Malta
-
 Mauritius
-
 Mexico
-
 Moldova
-
 Mongolia
-
 Montenegro
-
 Morocco
-
 Mozambique
-
 Myanmar
-
 Namibia
-
 Nepal
Nepal
-
 Netherlands
-
 New Zealand
-
 Nigeria
-
 North Macedonia
-
 Norway
-
 Oman
Oman
-
 Pakistan
-
 Palestine
-
 Panama
-
 Papua New Guinea
-
 Paraguay
-
 Peru
Peru
-
 Philippines
-
 Poland
-
 Portugal
-
 Puerto Rico
-
 Qatar
Qatar
-
 Reunion
-
 Romania
-
 Rwanda
-
 Saudi Arabia
-
 Serbia
-
 Singapore
-
 Slovakia
-
 Slovenia
-
 Somalia
-
 South Africa
-
 Spain
Spain
-
 Sri Lanka
-
 Sweden
-
 Switzerland
-
 Syria
Syria
-
 Taiwan
-
 Tajikistan
-
 Tanzania
-
 Thailand
-
 Trinidad and Tobago
-
 Tunisia
-
 Turkey
-
 UAE
UAE
-
 Uganda
-
 Ukraine
-
 United Kingdom
-
United States
-
 Uruguay
-
 Uzbekistan
-
 Venezuela
-
 Vietnam
-
 Yemen
Yemen
-
 Zambia
-
 Zimbabwe
- Forex
- Crypto











