
The Graph rises 7.07% as short-term buyers push price near session highs

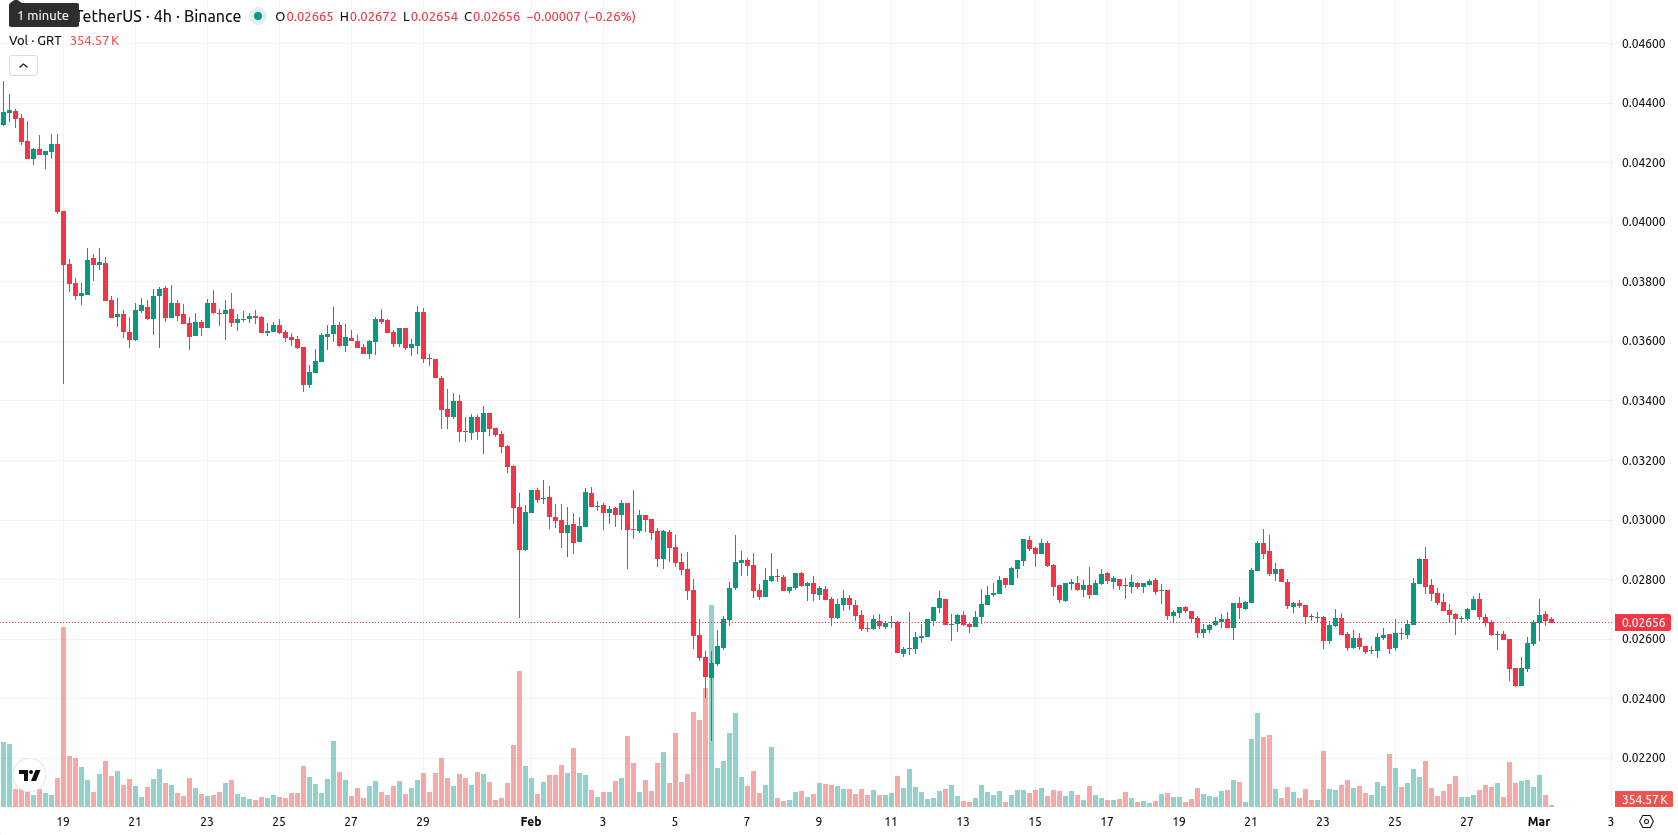
The Graph (GRT) is trading at $0.026595, up 7.07% on the day. The price remains below the 20-, 50-, and 200-period moving averages, indicating ongoing short-, medium-, and long-term seller pressure.
 0.01637
0.01697000
0.01637
0.01697000
Highlights
- GRT trades at $0.026595, below key moving averages (MA-20: $0.027051, MA-50: $0.032143, MA-200: $0.057842), indicating persistent downward pressure across all timeframes.
- Momentum indicators including MACD and ADX remain in 'Sell' or 'Strong Sell' on daily and weekly timeframes, with RSI showing persistent oversold readings near 42 (daily) and 26 (weekly).
- GRT is expected to consolidate within $0.0235–$0.0290 over the next five sessions, with strong resistance at the Ichimoku Kijun ($0.026780) and increased downside risk if $0.025900 support fails.
Mixed technical signals as sellers maintain advantage despite intraday strength
Momentum readings indicate a negative bias, with both the MACD and ADX on the daily and weekly timeframes in "Sell" or "Strong Sell" territory, suggesting a persistent bearish trend. The RSI on both daily and weekly intervals shows values near or below 42 and 26 respectively, aligning with oversold signals in the Commodity Channel Index and intermittent "Buy" flags from the Stochastic RSI—a divergence that points to building, but not yet overwhelming, buyer interest. Bull/Bear Power shows sellers remain in control intraday, while the daily gain of 7.07% (no opening gap) has pushed the price near the high of today’s range ($0.025917 — $0.027330) amid moderate volatility, indicating strength toward session highs though momentum and oscillators deliver mixed signals.
Downside risk prevails as all weekly indicators maintain sell bias
Looking ahead, the expected price range over the coming five sessions is $0.0235 to $0.0290, reflecting typical volatility for GRT at current prices. Given that all four key weekly indicators (RSI, ADX, MACD, MA-50) are in "Sell" territory, there is a very low probability (less than 20%) of a sustained price increase, making further easing much more likely. Baseline scenario: GRT consolidates between support and resistance; bullish case, a break above the Ichimoku Kijun ($0.026780) could allow a test of the upper end of the range; bearish case, a slip below near-term support ($0.025900) could expose further downside towards $0.0235.
The Graph (GRT) is exhibiting strong bearish momentum, trading well below its short-, medium-, and long-term moving averages, with daily technical indicators such as the MACD, ADX, and Awesome Oscillator confirming dominant selling pressure. Immediate resistance is noted at the Ichimoku Kijun level, while momentum and volatility signals suggest the asset is approaching but not yet in oversold territory, leaving further downside risk unless bullish reversal signals emerge.









-
 Afghanistan
-
 Albania
-
 Algeria
-
 Angola
-
 Argentina
-
 Armenia
-
 Australia
-
 Austria
-
 Azerbaijan
-
 Bahamas
-
 Bahrain
-
 Bangladesh
-
 Belarus
-
 Belgium
-
 Bolivia
-
 Botswana
-
 Brazil
-
 Brunei
-
 Bulgaria
-
 Cambodia
-
 Cameroon
-
 Canada
-
 Chile
Chile
-
 China
China
-
 Colombia
-
 Congo
Congo
-
 Costa Rica
-
 Cote d'Ivoire
-
 Croatia
-
 Cuba
Cuba
-
 Cyprus
-
 Czechia
-
 DR Congo
-
 Denmark
-
 Dominican Republic
-
 Ecuador
-
 Egypt
Egypt
-
 El Salvador
-
 Estonia
-
 Eswatini
-
 Ethiopia
-
 Finland
-
 France
-
 Georgia
-
 Germany
-
 Ghana
Ghana
-
 Greece
-
 Haiti
Haiti
-
 Hong Kong
-
 Hungary
-
 India
India
-
 Indonesia
-
 Iran, Islamic republic
-
 Iraq
Iraq
-
 Ireland
-
 Israel
-
 Italy
Italy
-
 Jamaica
-
 Japan
Japan
-
 Jordan
-
 Kazakhstan
-
 Kenya
Kenya
-
 Korea
Korea
-
 Kuwait
-
 Kyrgyzstan
-
 Laos
Laos
-
 Latvia
-
 Lebanon
-
 Lesotho
-
 Libya
Libya
-
 Lithuania
-
 Luxembourg
-
 Madagascar
-
 Malaysia
-
 Malta
Malta
-
 Mauritius
-
 Mexico
-
 Moldova
-
 Mongolia
-
 Montenegro
-
 Morocco
-
 Mozambique
-
 Myanmar
-
 Namibia
-
 Nepal
Nepal
-
 Netherlands
-
 New Zealand
-
 Nigeria
-
 North Macedonia
-
 Norway
-
 Oman
Oman
-
 Pakistan
-
 Palestine
-
 Panama
-
 Papua New Guinea
-
 Paraguay
-
 Peru
Peru
-
 Philippines
-
 Poland
-
 Portugal
-
 Puerto Rico
-
 Qatar
Qatar
-
 Reunion
-
 Romania
-
 Rwanda
-
 Saudi Arabia
-
 Serbia
-
 Singapore
-
 Slovakia
-
 Slovenia
-
 Somalia
-
 South Africa
-
 Spain
Spain
-
 Sri Lanka
-
 Sweden
-
 Switzerland
-
 Syria
Syria
-
 Taiwan
-
 Tajikistan
-
 Tanzania
-
 Thailand
-
 Trinidad and Tobago
-
 Tunisia
-
 Turkey
-
 UAE
UAE
-
 Uganda
-
 Ukraine
-
 United Kingdom
-
United States
-
 Uruguay
-
 Uzbekistan
-
 Venezuela
-
 Vietnam
-
 Yemen
Yemen
-
 Zambia
-
 Zimbabwe
- Forex
- Crypto












