
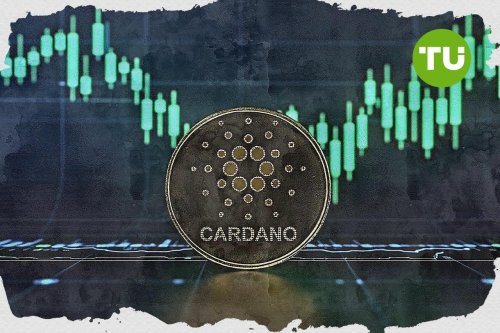
Cardano price hovers near $0.71 as volatility tightens and technical pressure builds

Cardano (ADA) continues to trade in a compressed range near $0.7120, reflecting a notable lack of conviction among traders. The 4-hour chart reveals a symmetrical triangle formation just above the $0.70 level, a classic consolidation pattern that often precedes a breakout.
Despite multiple attempts, ADA has failed to push past the upper resistance of the triangle or sustain momentum above key moving averages, indicating subdued bullish pressure.
Resistance is clearly defined at $0.75, a level marked by previous swing highs, while support lies in the $0.68–$0.69 region, where buying activity has historically emerged. Technical indicators paint a picture of indecision. ADA remains below the 20-, 50-, 100-, and 200-period EMAs, which cluster above the current price and reinforce downward bias. Until bulls reclaim the $0.73–$0.75 zone, upside attempts could remain short-lived.

Cardano price analysis (September 2024 - March 2025 ) Source: TradingView.
Indicators show muted momentum
The Relative Strength Index (RSI) stands at 49.09, hovering in neutral territory but gradually climbing from oversold levels. A break above 50 could signal returning bullish momentum, though confirmation is needed. Meanwhile, the MACD reveals a weak positive divergence, with the MACD line near 0.00039 just edging above the signal line. While this suggests bearish momentum may be fading, it does not confirm a reversal.
Bollinger Bands on the 4-hour chart have tightened, with the price sitting near the mid-band at $0.7129. Such squeezes often lead to sharp volatility expansions, reinforcing the probability of an imminent breakout. However, the direction remains uncertain.
Bears maintain control on higher timeframes
On the daily chart, ADA continues to face resistance from the descending trendline formed from its March 2025 high. The rejection near the $0.80 level, combined with weak candle closes, suggests limited strength from buyers. If the price breaks below the $0.69 support, ADA could test deeper demand zones near $0.64 and $0.58. On the upside, reclaiming the $0.75–$0.80 band would be needed to shift momentum in favor of bulls.
As noted in previous analysis, Cardano has shown a pattern of volatility compression around key EMAs and trendlines. Without volume-backed breakouts, the broader market remains in consolidation. The current price action reaffirms our view that ADA’s next impulse move hinges on clearing $0.75 or losing the $0.69 base.


Latest Cardano (ADA) News


-
 Afghanistan
-
 Albania
-
 Algeria
-
 Angola
-
 Argentina
-
 Armenia
-
 Australia
-
 Austria
-
 Azerbaijan
-
 Bahamas
-
 Bahrain
-
 Bangladesh
-
 Belarus
-
 Belgium
-
 Bolivia
-
 Botswana
-
 Brazil
-
 Brunei
-
 Bulgaria
-
 Cambodia
-
 Cameroon
-
 Canada
-
 Chile
Chile
-
 China
China
-
 Colombia
-
 Congo
Congo
-
 Costa Rica
-
 Cote d'Ivoire
-
 Croatia
-
 Cuba
Cuba
-
 Cyprus
-
 Czechia
-
 DR Congo
-
 Denmark
-
 Dominican Republic
-
 Ecuador
-
 Egypt
Egypt
-
 El Salvador
-
 Estonia
-
 Eswatini
-
 Ethiopia
-
 Finland
-
 France
-
 Georgia
-
 Germany
-
 Ghana
Ghana
-
 Greece
-
 Haiti
Haiti
-
 Hong Kong
-
 Hungary
-
 India
India
-
 Indonesia
-
 Iran, Islamic republic
-
 Iraq
Iraq
-
 Ireland
-
 Israel
-
 Italy
Italy
-
 Jamaica
-
 Japan
Japan
-
 Jordan
-
 Kazakhstan
-
 Kenya
Kenya
-
 Korea
Korea
-
 Kuwait
-
 Kyrgyzstan
-
 Laos
Laos
-
 Latvia
-
 Lebanon
-
 Lesotho
-
 Libya
Libya
-
 Lithuania
-
 Luxembourg
-
 Madagascar
-
 Malaysia
-
 Malta
Malta
-
 Mauritius
-
 Mexico
-
 Moldova
-
 Mongolia
-
 Montenegro
-
 Morocco
-
 Mozambique
-
 Myanmar
-
 Namibia
-
 Nepal
Nepal
-
 Netherlands
-
 New Zealand
-
 Nigeria
-
 North Macedonia
-
 Norway
-
 Oman
Oman
-
 Pakistan
-
 Palestine
-
 Panama
-
 Papua New Guinea
-
 Paraguay
-
 Peru
Peru
-
 Philippines
-
 Poland
-
 Portugal
-
 Puerto Rico
-
 Qatar
Qatar
-
 Reunion
-
 Romania
-
 Rwanda
-
 Saudi Arabia
-
 Serbia
-
 Singapore
-
 Slovakia
-
 Slovenia
-
 Somalia
-
 South Africa
-
 Spain
Spain
-
 Sri Lanka
-
 Sweden
-
 Switzerland
-
 Syria
Syria
-
 Taiwan
-
 Tajikistan
-
 Tanzania
-
 Thailand
-
 Trinidad and Tobago
-
 Tunisia
-
 Turkey
-
 UAE
UAE
-
 Uganda
-
 Ukraine
-
 United Kingdom
-
United States
-
 Uruguay
-
 Uzbekistan
-
 Venezuela
-
 Vietnam
-
 Yemen
Yemen
-
 Zambia
-
 Zimbabwe
- Forex
- Crypto
