
-7.09% for Flow — Long-term bearish pressure meets short-term volatility

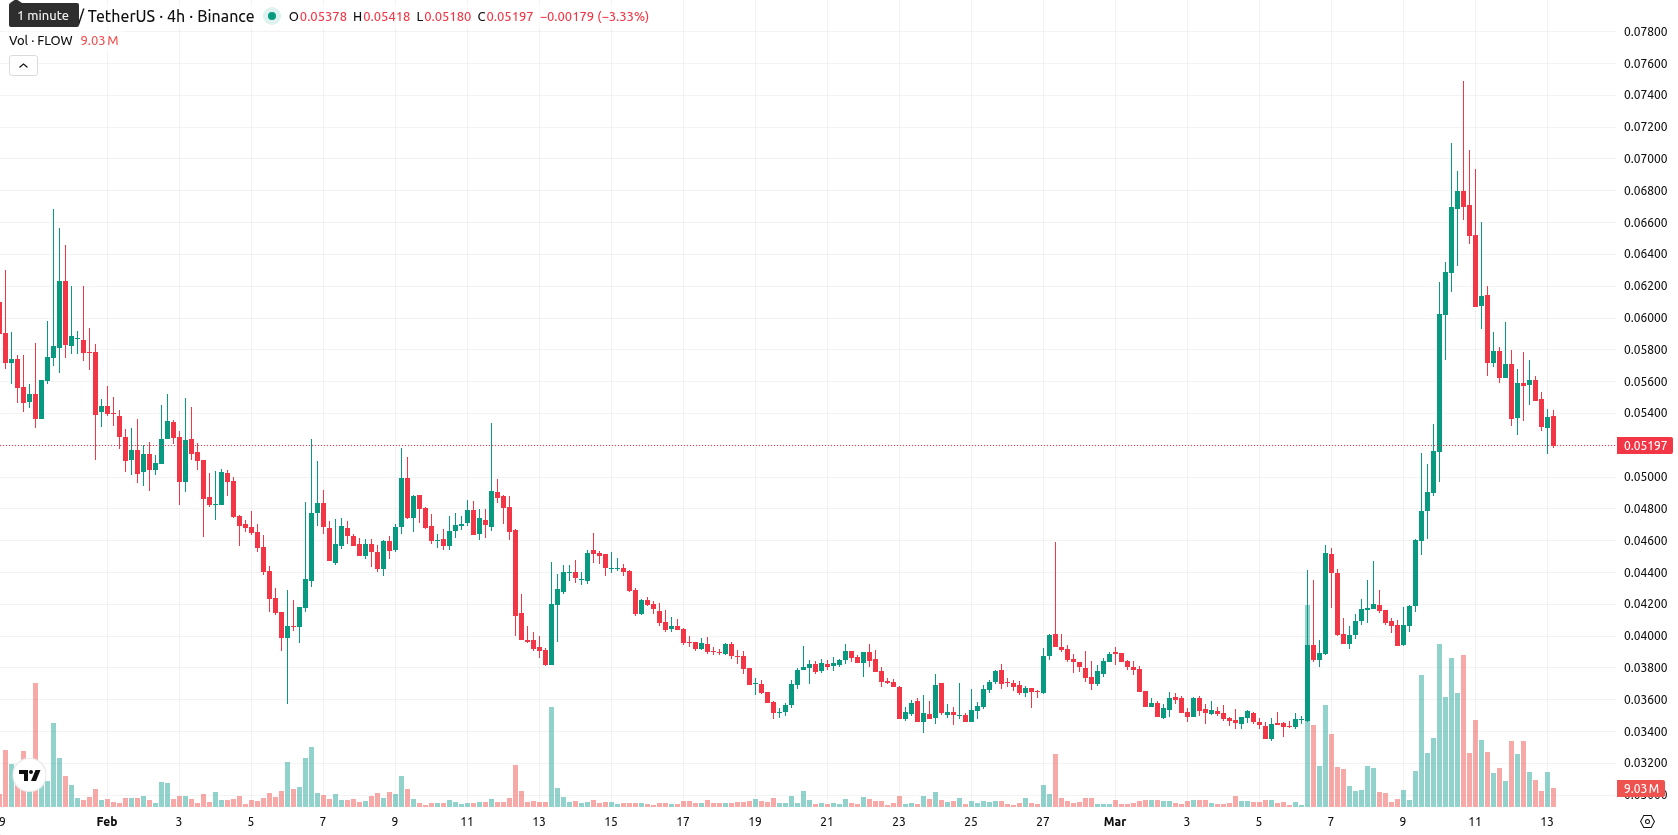
Flow (FLOW) is trading at $0.0524, above both the MA-20 ($0.0412) and MA-50 ($0.0467), but far below the MA-200 ($0.2061), signaling short- and medium-term buyer support but continued long-term bearish pressure. The Ichimoku Kijun sits at $0.0540, now acting as immediate resistance.
Highlights
- FLOW shows short- and medium-term buyer support but faces persistent long-term bearish pressure below the 200-day trend.
- Mixed momentum signals indicate limited near-term upside, with overbought conditions and high volatility dominating after recent declines.
- FLOW is likely to trade sideways in the $0.0500–$0.0560 range, with strong resistance at $0.0540 and downside risk prevailing.
Divergent momentum as mixed signals cap near-term upside
Momentum signals on the daily chart are mixed: ADX (31.87, Buy) indicates a strengthening trend, but MACD is neutral. RSI (57.7, Buy) and CCI (144, Overbought) suggest limited near-term upside, while Stoch RSI is neutral. BBP is positive (0.0110, Buy), pointing to mild buyer dominance intraday. The AO supports the bullish short-term trend. FLOW opened at $0.0531 following a minor gap down from the previous close at $0.0564 and has declined 7.09%. The current price sits near today’s intraday low, reflecting high volatility and persistent pressure after the open. Divergent oscillators highlight the risk of short-term mean reversion even as buyers and momentum signals briefly align.
Downside risk dominates as resistance limits rebound potential
Over the next five trading days, a typical volatility band relative to current levels is anticipated between $0.0500 and $0.0560. The probability of a price increase is very low (less than 20%), making further declines more likely. In the baseline scenario, FLOW trades sideways as short-term buyers meet resistance near $0.0540. Bullish momentum could emerge if price clears this resistance, opening the path toward $0.0560, but if selling intensifies and the price slips under $0.0500, a deeper retracement is likely as long-term trends remain negative.
Last time, analysts noted that Flow was trading above its short- and medium-term moving averages, confirming short-term bullish momentum, but remained well below its long-term average, reflecting ongoing bearish pressure. Despite mixed signals from RSI, MACD, and other oscillators amid elevated intraday volatility, the asset faces key resistance near $0.0540, with a higher probability of decline or sideways movement over the near term.


Latest FLOW News


-
 Afghanistan
-
 Albania
-
 Algeria
-
 Angola
-
 Argentina
-
 Armenia
-
 Australia
-
 Austria
-
 Azerbaijan
-
 Bahamas
-
 Bahrain
-
 Bangladesh
-
 Belarus
-
 Belgium
-
 Bolivia
-
 Botswana
-
 Brazil
-
 Brunei
-
 Bulgaria
-
 Cambodia
-
 Cameroon
-
 Canada
-
 Chile
Chile
-
 China
China
-
 Colombia
-
 Congo
Congo
-
 Costa Rica
-
 Cote d'Ivoire
-
 Croatia
-
 Cuba
Cuba
-
 Cyprus
-
 Czechia
-
 DR Congo
-
 Denmark
-
 Dominican Republic
-
 Ecuador
-
 Egypt
Egypt
-
 El Salvador
-
 Estonia
-
 Eswatini
-
 Ethiopia
-
 Finland
-
 France
-
 Georgia
-
 Germany
-
 Ghana
Ghana
-
 Greece
-
 Haiti
Haiti
-
 Hong Kong
-
 Hungary
-
 India
India
-
 Indonesia
-
 Iran, Islamic republic
-
 Iraq
Iraq
-
 Ireland
-
 Israel
-
 Italy
Italy
-
 Jamaica
-
 Japan
Japan
-
 Jordan
-
 Kazakhstan
-
 Kenya
Kenya
-
 Korea
Korea
-
 Kuwait
-
 Kyrgyzstan
-
 Laos
Laos
-
 Latvia
-
 Lebanon
-
 Lesotho
-
 Libya
Libya
-
 Lithuania
-
 Luxembourg
-
 Madagascar
-
 Malaysia
-
 Malta
Malta
-
 Mauritius
-
 Mexico
-
 Moldova
-
 Mongolia
-
 Montenegro
-
 Morocco
-
 Mozambique
-
 Myanmar
-
 Namibia
-
 Nepal
Nepal
-
 Netherlands
-
 New Zealand
-
 Nigeria
-
 North Macedonia
-
 Norway
-
 Oman
Oman
-
 Pakistan
-
 Palestine
-
 Panama
-
 Papua New Guinea
-
 Paraguay
-
 Peru
Peru
-
 Philippines
-
 Poland
-
 Portugal
-
 Puerto Rico
-
 Qatar
Qatar
-
 Reunion
-
 Romania
-
 Rwanda
-
 Saudi Arabia
-
 Serbia
-
 Singapore
-
 Slovakia
-
 Slovenia
-
 Somalia
-
 South Africa
-
 Spain
Spain
-
 Sri Lanka
-
 Sweden
-
 Switzerland
-
 Syria
Syria
-
 Taiwan
-
 Tajikistan
-
 Tanzania
-
 Thailand
-
 Trinidad and Tobago
-
 Tunisia
-
 Turkey
-
 UAE
UAE
-
 Uganda
-
 Ukraine
-
 United Kingdom
-
United States
-
 Uruguay
-
 Uzbekistan
-
 Venezuela
-
 Vietnam
-
 Yemen
Yemen
-
 Zambia
-
 Zimbabwe
- Forex
- Crypto
