
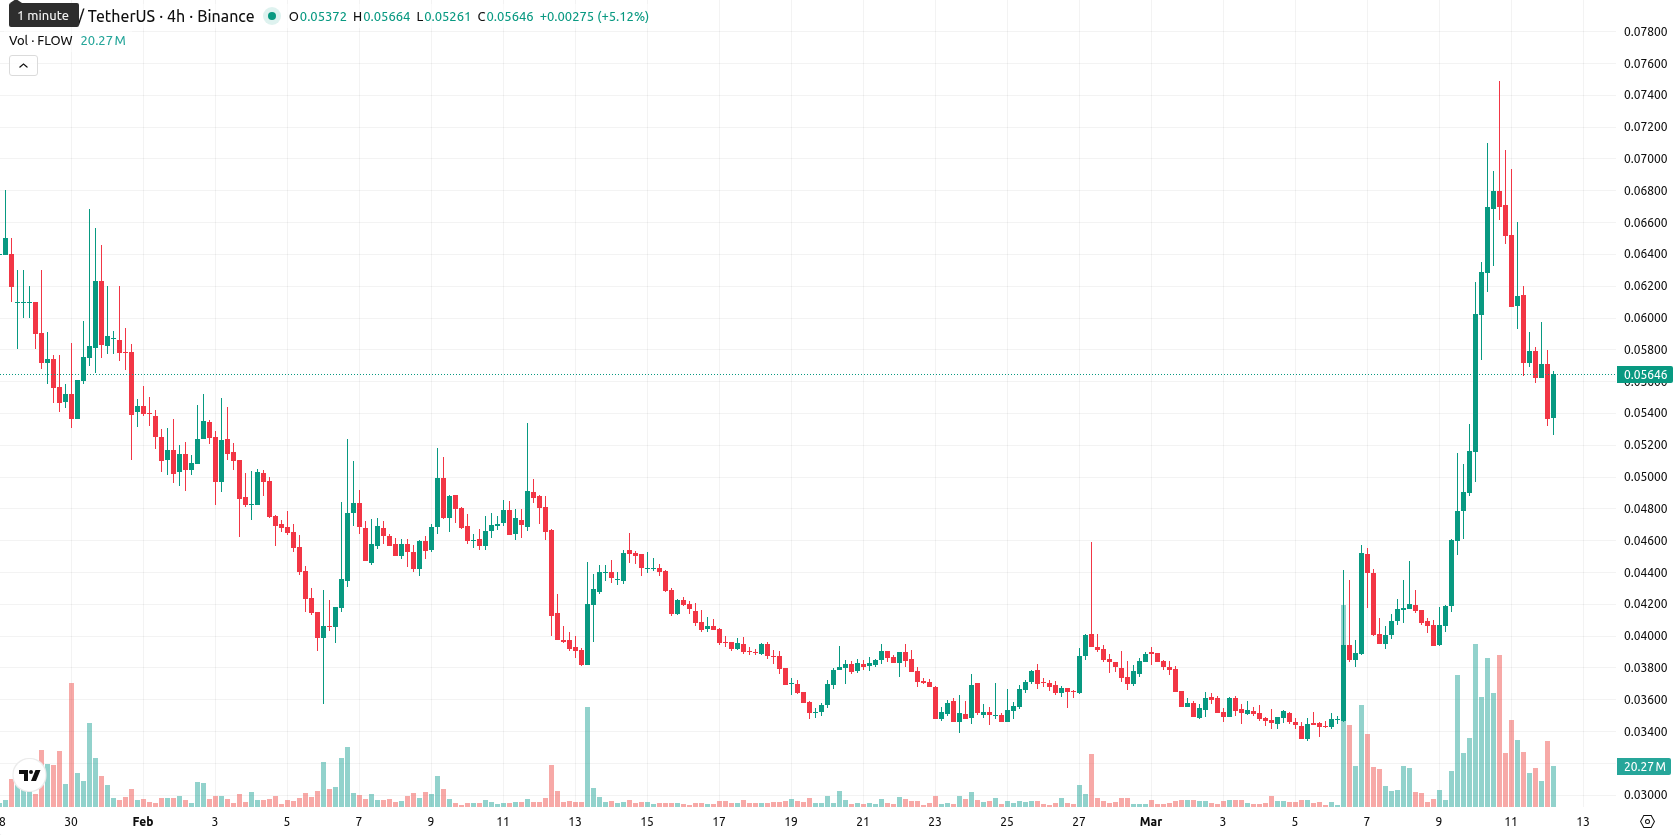
-11.29% for Flow — Sellers dominate as buyers lose momentum amid intraday volatility

Flow (FLOW) is trading at $0.0558, which is positioned above both the SMA-20 ($0.0405) and SMA-50 ($0.0471), confirming short- and medium-term bullish momentum. However, the price remains far below the SMA-200 ($0.2079), indicating ongoing long-term bearish pressure, while the Ichimoku Kijun (D1) at $0.0540 now serves as immediate resistance.
Highlights
- FLOW maintains short- and medium-term bullish momentum but remains in a long-term downtrend below key averages.
- Mixed technical signals and overbought oscillators point to elevated volatility and rising risk of a near-term reversal.
- Price is expected to fluctuate within a $0.0530–$0.0580 band over five days, with a higher probability of further declines.
Mixed overbought signals as intraday volatility sparks reversal risk
Momentum signals are mixed: ADX (D1) suggests a strong trend, while MACD (D1) is neutral. RSI (D1) near 62 and CCI (D1) in overbought territory indicate caution, with Stoch RSI (D1) confirming overbought conditions and BBP (D1) pointing to buyer dominance intraday. AO (D1) is supportive of the short-term uptrend, but today the price has dropped 11.29% from the previous close, opening slightly lower with no significant gap. The current price sits close to today’s low within a narrow $0.0528 – $0.0580 range, underscoring high intraday volatility and pronounced pressure after the open. Divergences between overbought oscillators and continued buyer momentum highlight a near-term risk of reversal.
Decline risk rises as bearish signals converge with narrow trading range
Looking ahead, over the next five trading days FLOW is expected to move in the $0.0530 – $0.0580 range. The probability of a price increase is very low (less than 20%), making further decline more likely given the persistent bearish signals on weekly MA-50, MACD, ADX, and RSI. The baseline scenario foresees sideways fluctuations in the narrow corridor. A bullish scenario would require a breakout above immediate resistance around $0.0540 – $0.0580, targeting the upper end of the range. Conversely, a bearish scenario would see FLOW slip below $0.0530 and potentially test new short-term lows, consistent with prevailing long-term weakness.
Previously it was reported that Flow (FLOW) trades above its short- and medium-term moving averages but remains well below its long-term average, indicating bullish momentum tempered by significant overhead resistance. Despite increased trading activity and strong weekly gains, mixed signals from momentum indicators and elevated volatility suggest near-term caution, with key support at $0.0540 and resistance near $0.0600.


-
 Afghanistan
-
 Albania
-
 Algeria
-
 Angola
-
 Argentina
-
 Armenia
-
 Australia
-
 Austria
-
 Azerbaijan
-
 Bahamas
-
 Bahrain
-
 Bangladesh
-
 Belarus
-
 Belgium
-
 Bolivia
-
 Botswana
-
 Brazil
-
 Brunei
-
 Bulgaria
-
 Cambodia
-
 Cameroon
-
 Canada
-
 Chile
Chile
-
 China
China
-
 Colombia
-
 Congo
Congo
-
 Costa Rica
-
 Cote d'Ivoire
-
 Croatia
-
 Cuba
Cuba
-
 Cyprus
-
 Czechia
-
 DR Congo
-
 Denmark
-
 Dominican Republic
-
 Ecuador
-
 Egypt
Egypt
-
 El Salvador
-
 Estonia
-
 Eswatini
-
 Ethiopia
-
 Finland
-
 France
-
 Georgia
-
 Germany
-
 Ghana
Ghana
-
 Greece
-
 Haiti
Haiti
-
 Hong Kong
-
 Hungary
-
 India
India
-
 Indonesia
-
 Iran, Islamic republic
-
 Iraq
Iraq
-
 Ireland
-
 Israel
-
 Italy
Italy
-
 Jamaica
-
 Japan
Japan
-
 Jordan
-
 Kazakhstan
-
 Kenya
Kenya
-
 Korea
Korea
-
 Kuwait
-
 Kyrgyzstan
-
 Laos
Laos
-
 Latvia
-
 Lebanon
-
 Lesotho
-
 Libya
Libya
-
 Lithuania
-
 Luxembourg
-
 Madagascar
-
 Malaysia
-
 Malta
Malta
-
 Mauritius
-
 Mexico
-
 Moldova
-
 Mongolia
-
 Montenegro
-
 Morocco
-
 Mozambique
-
 Myanmar
-
 Namibia
-
 Nepal
Nepal
-
 Netherlands
-
 New Zealand
-
 Nigeria
-
 North Macedonia
-
 Norway
-
 Oman
Oman
-
 Pakistan
-
 Palestine
-
 Panama
-
 Papua New Guinea
-
 Paraguay
-
 Peru
Peru
-
 Philippines
-
 Poland
-
 Portugal
-
 Puerto Rico
-
 Qatar
Qatar
-
 Reunion
-
 Romania
-
 Rwanda
-
 Saudi Arabia
-
 Serbia
-
 Singapore
-
 Slovakia
-
 Slovenia
-
 Somalia
-
 South Africa
-
 Spain
Spain
-
 Sri Lanka
-
 Sweden
-
 Switzerland
-
 Syria
Syria
-
 Taiwan
-
 Tajikistan
-
 Tanzania
-
 Thailand
-
 Trinidad and Tobago
-
 Tunisia
-
 Turkey
-
 UAE
UAE
-
 Uganda
-
 Ukraine
-
 United Kingdom
-
United States
-
 Uruguay
-
 Uzbekistan
-
 Venezuela
-
 Vietnam
-
 Yemen
Yemen
-
 Zambia
-
 Zimbabwe
- Forex
- Crypto
