
Solana dips as SEC labeling limits ETF access

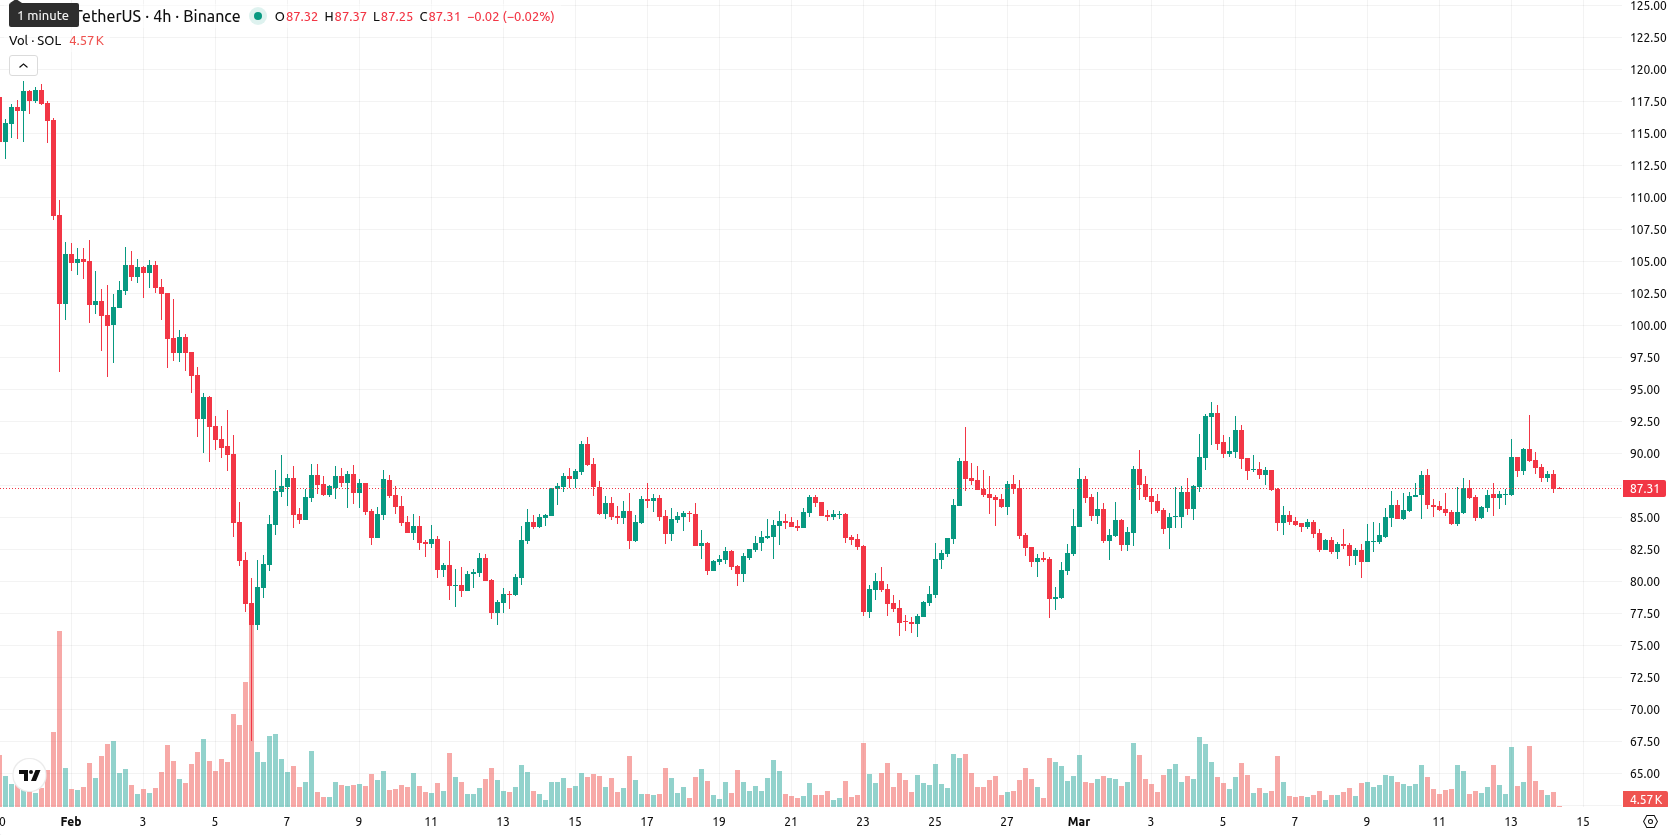
Solana (SOL) is trading at $87.36, above the MA-20 ($84.93) but below the MA-50 ($92.34) and well beneath the MA-200 ($150.63). This configuration indicates a short-term bullish structure, moderate medium-term resistance, and ongoing long-term bearish momentum, with the Ichimoku Kijun at $84.84 providing immediate support.
Highlights
- Solana spot ETFs saw $2.48 million in net outflows amid ongoing SEC classification uncertainty and heightened regulatory risk.
- Broader market liquidations and new tariff announcements prompted capital rotations out of Solana, despite integration into Mastercard’s crypto program.
- SOL trades below medium- and long-term resistance with technical signals indicating a higher probability of further declines toward $79.00, while sideways consolidation is likely in the near term.
ETF outflows and regulatory scrutiny limit institutional demand for Solana
The SEC previously classified Solana as a potential unregistered security, restricting institutional access and ETF eligibility as regulatory clarity has not been provided. On March 9, Solana spot ETFs recorded net outflows of $2.48 million, mainly from VanEck and Fidelity, reflecting sensitivity to regulatory developments. Earlier, global crypto market liquidations caused capital movement away from Solana in response to new tariff announcements. Integration into Mastercard's Crypto Partner Program and the launch of Solmate Infrastructure's hub in Abu Dhabi were reported, though price action has remained under broader selling pressure.
Mixed technical momentum as overbought signals compete with bearish pressure
Momentum signals on the D1 timeframe show mixed dynamics: MACD indicates strong bearish momentum while ADX also confirms underlying seller control. The RSI is neutral at 50.91, but both the CCI and Stoch RSI show overbought signals, suggesting stretched short-term conditions. BBP is flagged as overbought, indicating continued buyer dominance, though this conflicts with the day's negative move. The AO supports the buy trend, contrasting with prevailing momentum; SOL opened slightly lower, traded near the session low within today's $87.06 – $88.70 range, and experienced subdued volatility, highlighting uncertainty as selling does not fully align with overbought oscillator signals.
Downside risk persists as weak buy signals face strong resistance
For the coming week, SOL is likely to trade within a $79.00 – $95.00 volatility band relative to current levels. The probability of a price increase is very low (less than 20%), with a further decline being more likely due to persistent sell signals from the RSI, ADX, MACD, and major moving averages. The base case remains for sideways movement between nearby support and resistance, with a bullish scenario requiring a firm breakout above the $88.00 – $90.00 zone, while a bearish outcome could push the price below immediate support at $84.84 toward the lower band near $79.00.
Previously it was reported that Solana was exhibiting short-term upward momentum constrained by continued selling pressure and technical resistance, implying a tendency toward sideways consolidation. The ongoing regulatory uncertainty, recent ETF outflows, and persistent bearish technical signals now reinforce the importance of monitoring the $84.84 support level, as a breakdown below this area could accelerate downside risk in the near term.


-
 Afghanistan
-
 Albania
-
 Algeria
-
 Angola
-
 Argentina
-
 Armenia
-
 Australia
-
 Austria
-
 Azerbaijan
-
 Bahamas
-
 Bahrain
-
 Bangladesh
-
 Belarus
-
 Belgium
-
 Bolivia
-
 Botswana
-
 Brazil
-
 Brunei
-
 Bulgaria
-
 Cambodia
-
 Cameroon
-
 Canada
-
 Chile
Chile
-
 China
China
-
 Colombia
-
 Congo
Congo
-
 Costa Rica
-
 Cote d'Ivoire
-
 Croatia
-
 Cuba
Cuba
-
 Cyprus
-
 Czechia
-
 DR Congo
-
 Denmark
-
 Dominican Republic
-
 Ecuador
-
 Egypt
Egypt
-
 El Salvador
-
 Estonia
-
 Eswatini
-
 Ethiopia
-
 Finland
-
 France
-
 Georgia
-
 Germany
-
 Ghana
Ghana
-
 Greece
-
 Haiti
Haiti
-
 Hong Kong
-
 Hungary
-
 India
India
-
 Indonesia
-
 Iran, Islamic republic
-
 Iraq
Iraq
-
 Ireland
-
 Israel
-
 Italy
Italy
-
 Jamaica
-
 Japan
Japan
-
 Jordan
-
 Kazakhstan
-
 Kenya
Kenya
-
 Korea
Korea
-
 Kuwait
-
 Kyrgyzstan
-
 Laos
Laos
-
 Latvia
-
 Lebanon
-
 Lesotho
-
 Libya
Libya
-
 Lithuania
-
 Luxembourg
-
 Madagascar
-
 Malaysia
-
 Malta
Malta
-
 Mauritius
-
 Mexico
-
 Moldova
-
 Mongolia
-
 Montenegro
-
 Morocco
-
 Mozambique
-
 Myanmar
-
 Namibia
-
 Nepal
Nepal
-
 Netherlands
-
 New Zealand
-
 Nigeria
-
 North Macedonia
-
 Norway
-
 Oman
Oman
-
 Pakistan
-
 Palestine
-
 Panama
-
 Papua New Guinea
-
 Paraguay
-
 Peru
Peru
-
 Philippines
-
 Poland
-
 Portugal
-
 Puerto Rico
-
 Qatar
Qatar
-
 Reunion
-
 Romania
-
 Rwanda
-
 Saudi Arabia
-
 Serbia
-
 Singapore
-
 Slovakia
-
 Slovenia
-
 Somalia
-
 South Africa
-
 Spain
Spain
-
 Sri Lanka
-
 Sweden
-
 Switzerland
-
 Syria
Syria
-
 Taiwan
-
 Tajikistan
-
 Tanzania
-
 Thailand
-
 Trinidad and Tobago
-
 Tunisia
-
 Turkey
-
 UAE
UAE
-
 Uganda
-
 Ukraine
-
 United Kingdom
-
United States
-
 Uruguay
-
 Uzbekistan
-
 Venezuela
-
 Vietnam
-
 Yemen
Yemen
-
 Zambia
-
 Zimbabwe
- Forex
- Crypto
