
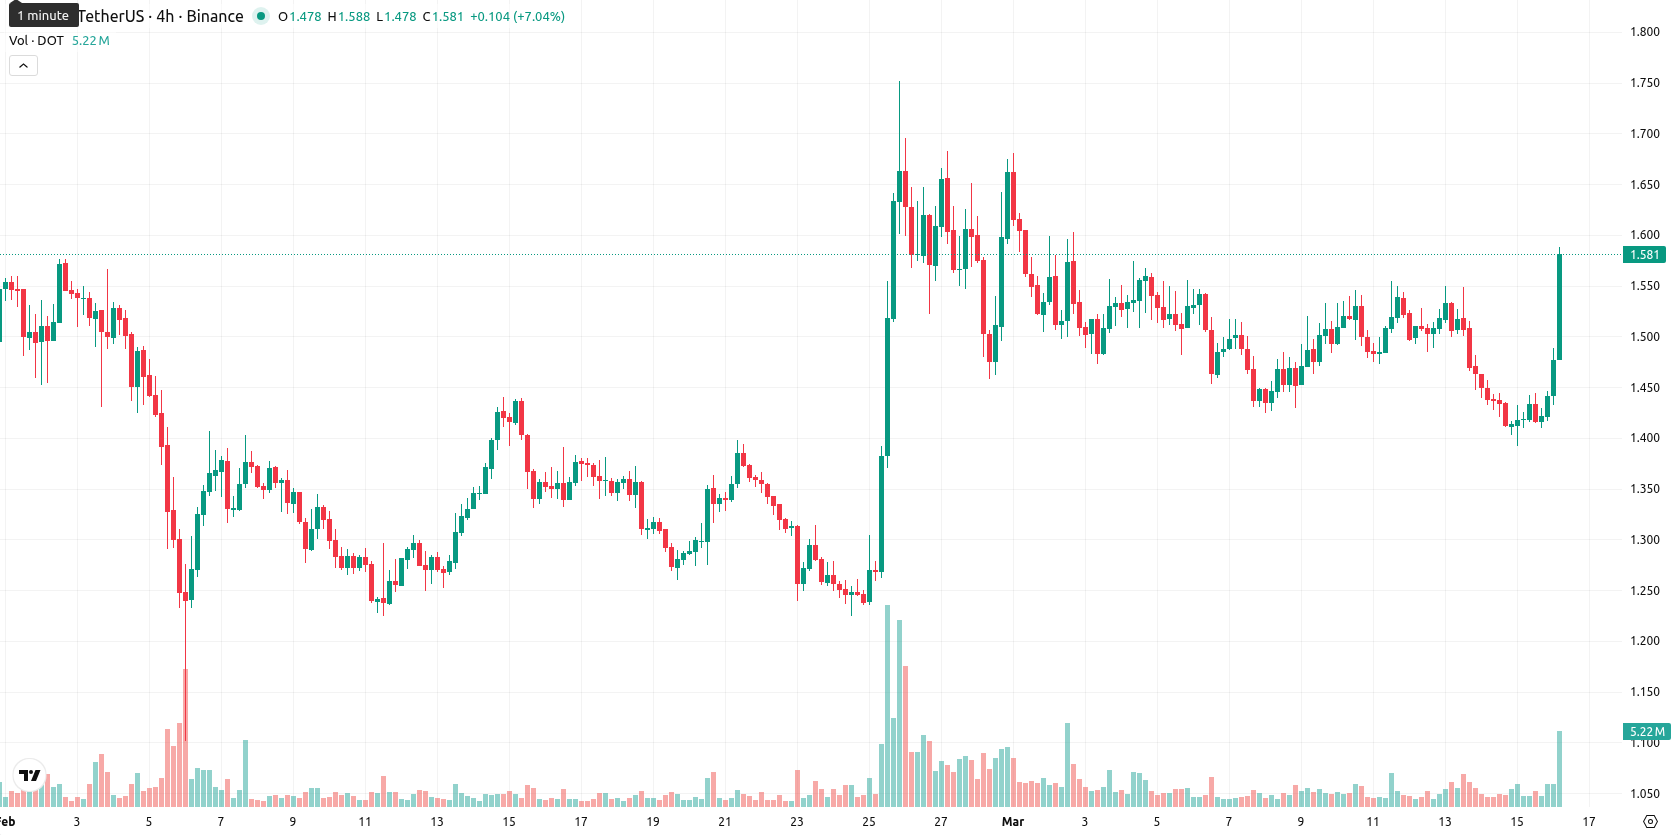
+11.54% for Polkadot — Price holds above support but upside faces major resistance

Polkadot (DOT) is trading at $1.575, up 11.54% on the day. The asset currently holds above both its MA-20 ($1.507) and MA-50 ($1.474), but remains well below the longer-term MA-200 ($2.538), indicating sustained short- and medium-term strength while showing persistent long-term bearish momentum.
Highlights
- Polkadot's on-chain fees stabilize at 10,000 DOT daily as adoption metrics and parachain activity show little change.
- Trading volumes are 38% below the monthly average amid continued bearish sentiment and divided community outlook post-BTC correction.
- DOT shows short-term strength with elevated volatility but remains capped by larger bearish momentum, with a projected range of $1.45–$1.63 barring a breakout or breakdown.
Muted trading activity as sentiment worsens after BTC correction
On-chain activity for Polkadot shows transaction fees have steadied at around 10,000 DOT per day with approximately 1,200 active parachains, while adoption metrics remain largely unchanged. Trading volumes have been reported 38% below the monthly average, pointing to muted engagement on exchanges. Social media sentiment is predominantly bearish following a recent correction in BTC, with divided community discussions about the current state of the Polkadot 2.0 ecosystem.
Weak momentum and mixed signals as DOT tests technical divergence
DOT is demonstrating notable technical divergence: the price sits above the Ichimoku Kijun level at $1.489, now acting as immediate support. Momentum indicators are mixed — the MACD on D1 is still in sell mode and the ADX confirms weak trend strength. Both RSI at 45 and CCI remain in sell zones, indicative of underlying weakness, though the Stoch RSI signals oversold conditions that could suggest a rebound. The BBP shows mild seller dominance on D1, while short-term timeframes highlight growing buyer activity. The Awesome Oscillator is currently neutral, not confirming the present bullish move. Volatility has increased, with DOT opening higher on a modest upward gap and trading near session highs after its 11.54% rally.
Limited upside prospects as sell signals outweigh rebound risks
In the near term, DOT is expected to trade within a typical volatility band of $1.45 to $1.63 given recent elevated price swings. The probability of sustained upside is low, with a less than 20% chance due to weekly sell signals from the RSI, ADX, MACD, and MA-50, making further declines more likely. The baseline scenario anticipates continued sideways movement with price action oscillating above immediate support, while broader bearish pressure persists. A breakout above $1.63 with renewed momentum could initiate a bullish move, whereas a close below $1.45 accompanied by renewed seller dominance would trigger a bearish scenario.
Earlier, analysts noted that Polkadot was exhibiting short-term resilience amid broader downtrend pressures, with network fundamentals remaining steady and sentiment cautious after Bitcoin's decline. The latest data strengthens this view, as despite DOT's sharp intraday rally and mixed momentum signals, the asset continues to face downside risk and traders should monitor for a decisive move above $1.63 or a breakdown below $1.45 to gauge the next directional shift.


Latest Polkadot News


-
 Afghanistan
-
 Albania
-
 Algeria
-
 Angola
-
 Argentina
-
 Armenia
-
 Australia
-
 Austria
-
 Azerbaijan
-
 Bahamas
-
 Bahrain
-
 Bangladesh
-
 Belarus
-
 Belgium
-
 Bolivia
-
 Botswana
-
 Brazil
-
 Brunei
-
 Bulgaria
-
 Cambodia
-
 Cameroon
-
 Canada
-
 Chile
Chile
-
 China
China
-
 Colombia
-
 Congo
Congo
-
 Costa Rica
-
 Cote d'Ivoire
-
 Croatia
-
 Cuba
Cuba
-
 Cyprus
-
 Czechia
-
 DR Congo
-
 Denmark
-
 Dominican Republic
-
 Ecuador
-
 Egypt
Egypt
-
 El Salvador
-
 Estonia
-
 Eswatini
-
 Ethiopia
-
 Finland
-
 France
-
 Georgia
-
 Germany
-
 Ghana
Ghana
-
 Greece
-
 Haiti
Haiti
-
 Hong Kong
-
 Hungary
-
 India
India
-
 Indonesia
-
 Iran, Islamic republic
-
 Iraq
Iraq
-
 Ireland
-
 Israel
-
 Italy
Italy
-
 Jamaica
-
 Japan
Japan
-
 Jordan
-
 Kazakhstan
-
 Kenya
Kenya
-
 Korea
Korea
-
 Kuwait
-
 Kyrgyzstan
-
 Laos
Laos
-
 Latvia
-
 Lebanon
-
 Lesotho
-
 Libya
Libya
-
 Lithuania
-
 Luxembourg
-
 Madagascar
-
 Malaysia
-
 Malta
Malta
-
 Mauritius
-
 Mexico
-
 Moldova
-
 Mongolia
-
 Montenegro
-
 Morocco
-
 Mozambique
-
 Myanmar
-
 Namibia
-
 Nepal
Nepal
-
 Netherlands
-
 New Zealand
-
 Nigeria
-
 North Macedonia
-
 Norway
-
 Oman
Oman
-
 Pakistan
-
 Palestine
-
 Panama
-
 Papua New Guinea
-
 Paraguay
-
 Peru
Peru
-
 Philippines
-
 Poland
-
 Portugal
-
 Puerto Rico
-
 Qatar
Qatar
-
 Reunion
-
 Romania
-
 Rwanda
-
 Saudi Arabia
-
 Serbia
-
 Singapore
-
 Slovakia
-
 Slovenia
-
 Somalia
-
 South Africa
-
 Spain
Spain
-
 Sri Lanka
-
 Sweden
-
 Switzerland
-
 Syria
Syria
-
 Taiwan
-
 Tajikistan
-
 Tanzania
-
 Thailand
-
 Trinidad and Tobago
-
 Tunisia
-
 Turkey
-
 UAE
UAE
-
 Uganda
-
 Ukraine
-
 United Kingdom
-
United States
-
 Uruguay
-
 Uzbekistan
-
 Venezuela
-
 Vietnam
-
 Yemen
Yemen
-
 Zambia
-
 Zimbabwe
- Forex
- Crypto
