
Sustained bearish signals from technicals: Ethena drops 9.45%

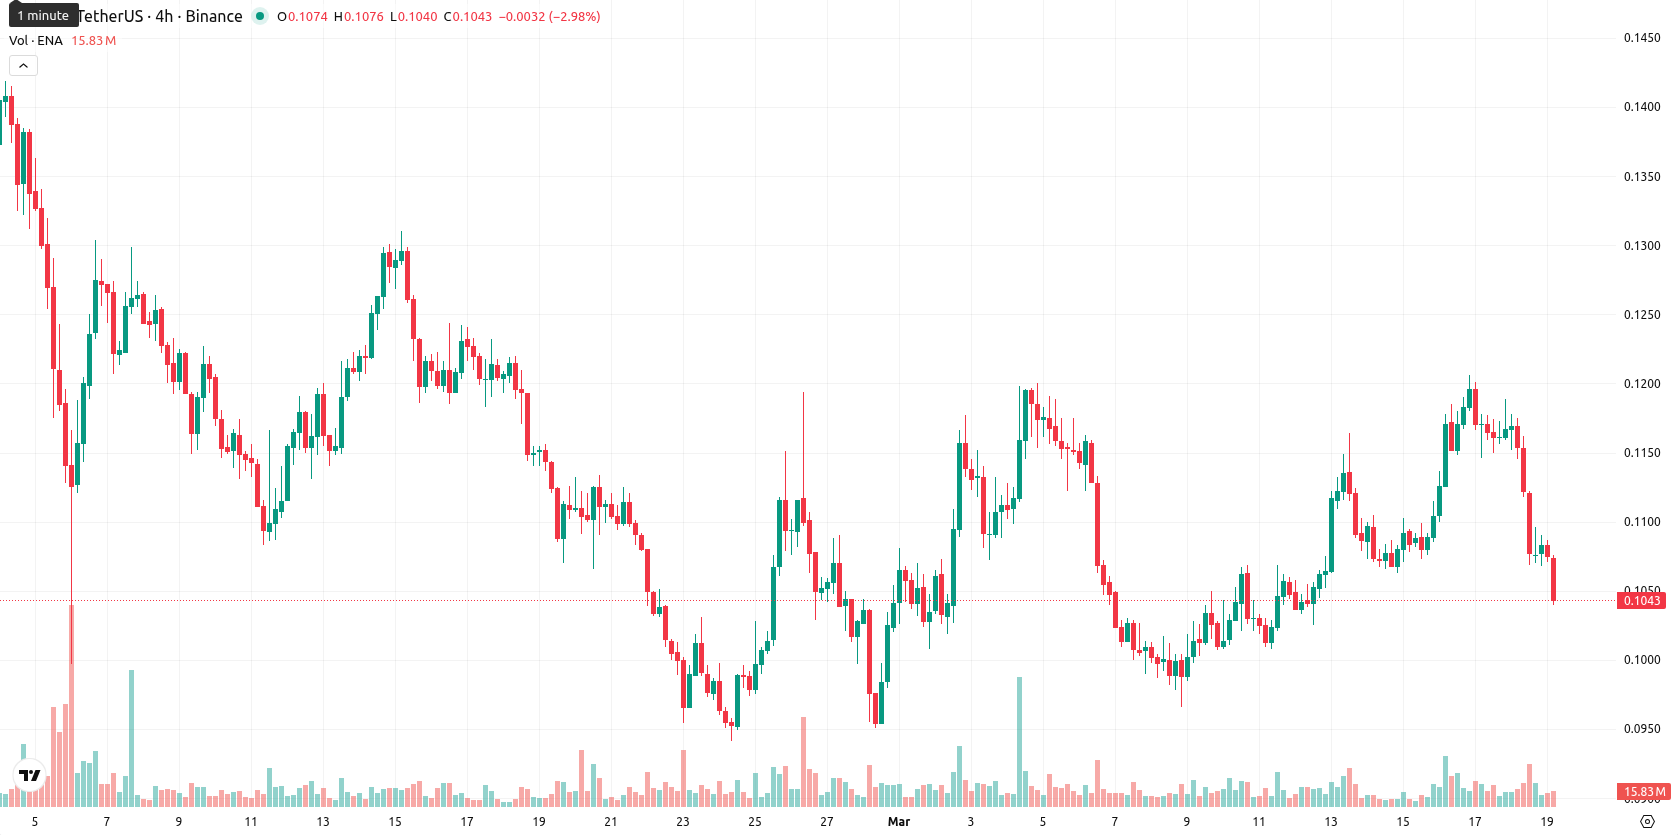
Ethena (ENA) is trading below the MA-20 ($0.1080), MA-50 ($0.1171), and MA-200 ($0.3186), which indicates persistent selling pressure over the short, medium, and long term. The current price of $0.1044 is positioned below the Ichimoku Kijun resistance at $0.1074.
Highlights
- ENA remains under pressure as it trades below key moving averages on all major timeframes, signaling dominant selling activity.
- Momentum indicators such as MACD and ADX confirm a prevailing downtrend, with RSI and CCI showing mild negativity.
- Price is expected to stay within the $0.0956–$0.1085 range over the next 5 days, with downside risk remaining high unless $0.1074 is reclaimed.
Bearish momentum persists as indicators signal weak buyer presence
Technical analysis shows momentum remains weak for ENA as MACD signals a strong sell and ADX on the daily timeframe confirms a prevailing downtrend. Both RSI and CCI are mildly negative, while Stoch RSI is neutral on D1 but oversold on intraday timeframes. Bull/Bear Power (BBP) suggests modest buyer presence on D1 but sellers dominate all shorter intervals. The Awesome Oscillator is slightly bullish on D1, which does not counterbalance the overall bearish structure. The current price is near today's low within a limited range, confirming low volatility and continued downside pressure after the open.
Downside scenario favored as indicators reinforce consolidation risk
Over the next five trading days, the typical volatility band is projected between $0.0956 and $0.1085. The likelihood of a price increase is very low (less than 20%), with downside favored due to sustained sell signals from moving averages, RSI, MACD, and ADX on daily and weekly timeframes. The baseline scenario anticipates ENA consolidating sideways; a bullish scenario would require sustained movement above $0.1074 to target $0.1085, whereas a drop below $0.0956 could accelerate further declines as bearish momentum builds.
Earlier, analysts noted that Ethena was constrained by persistent bearish momentum, limiting short-term rally potential despite protocol developments and increased institutional activity. With current technicals reinforcing the prevailing downtrend, traders should focus on the $0.0956 support area as a key level, as a sustained break below this threshold could signal an accelerated move lower.


Latest Ethena News


-
 Afghanistan
-
 Albania
-
 Algeria
-
 Angola
-
 Argentina
-
 Armenia
-
 Australia
-
 Austria
-
 Azerbaijan
-
 Bahamas
-
 Bahrain
-
 Bangladesh
-
 Belarus
-
 Belgium
-
 Bolivia
-
 Botswana
-
 Brazil
-
 Brunei
-
 Bulgaria
-
 Cambodia
-
 Cameroon
-
 Canada
-
 Chile
Chile
-
 China
China
-
 Colombia
-
 Congo
Congo
-
 Costa Rica
-
 Cote d'Ivoire
-
 Croatia
-
 Cuba
Cuba
-
 Cyprus
-
 Czechia
-
 DR Congo
-
 Denmark
-
 Dominican Republic
-
 Ecuador
-
 Egypt
Egypt
-
 El Salvador
-
 Estonia
-
 Eswatini
-
 Ethiopia
-
 Finland
-
 France
-
 Georgia
-
 Germany
-
 Ghana
Ghana
-
 Greece
-
 Haiti
Haiti
-
 Hong Kong
-
 Hungary
-
 India
India
-
 Indonesia
-
 Iran, Islamic republic
-
 Iraq
Iraq
-
 Ireland
-
 Israel
-
 Italy
Italy
-
 Jamaica
-
 Japan
Japan
-
 Jordan
-
 Kazakhstan
-
 Kenya
Kenya
-
 Korea
Korea
-
 Kuwait
-
 Kyrgyzstan
-
 Laos
Laos
-
 Latvia
-
 Lebanon
-
 Lesotho
-
 Libya
Libya
-
 Lithuania
-
 Luxembourg
-
 Madagascar
-
 Malaysia
-
 Malta
Malta
-
 Mauritius
-
 Mexico
-
 Moldova
-
 Mongolia
-
 Montenegro
-
 Morocco
-
 Mozambique
-
 Myanmar
-
 Namibia
-
 Nepal
Nepal
-
 Netherlands
-
 New Zealand
-
 Nigeria
-
 North Macedonia
-
 Norway
-
 Oman
Oman
-
 Pakistan
-
 Palestine
-
 Panama
-
 Papua New Guinea
-
 Paraguay
-
 Peru
Peru
-
 Philippines
-
 Poland
-
 Portugal
-
 Puerto Rico
-
 Qatar
Qatar
-
 Reunion
-
 Romania
-
 Rwanda
-
 Saudi Arabia
-
 Serbia
-
 Singapore
-
 Slovakia
-
 Slovenia
-
 Somalia
-
 South Africa
-
 Spain
Spain
-
 Sri Lanka
-
 Sweden
-
 Switzerland
-
 Syria
Syria
-
 Taiwan
-
 Tajikistan
-
 Tanzania
-
 Thailand
-
 Trinidad and Tobago
-
 Tunisia
-
 Turkey
-
 UAE
UAE
-
 Uganda
-
 Ukraine
-
 United Kingdom
-
United States
-
 Uruguay
-
 Uzbekistan
-
 Venezuela
-
 Vietnam
-
 Yemen
Yemen
-
 Zambia
-
 Zimbabwe
- Forex
- Crypto
