
Jito: Elevated volatility triggers a 7.36% decline despite short-term strength

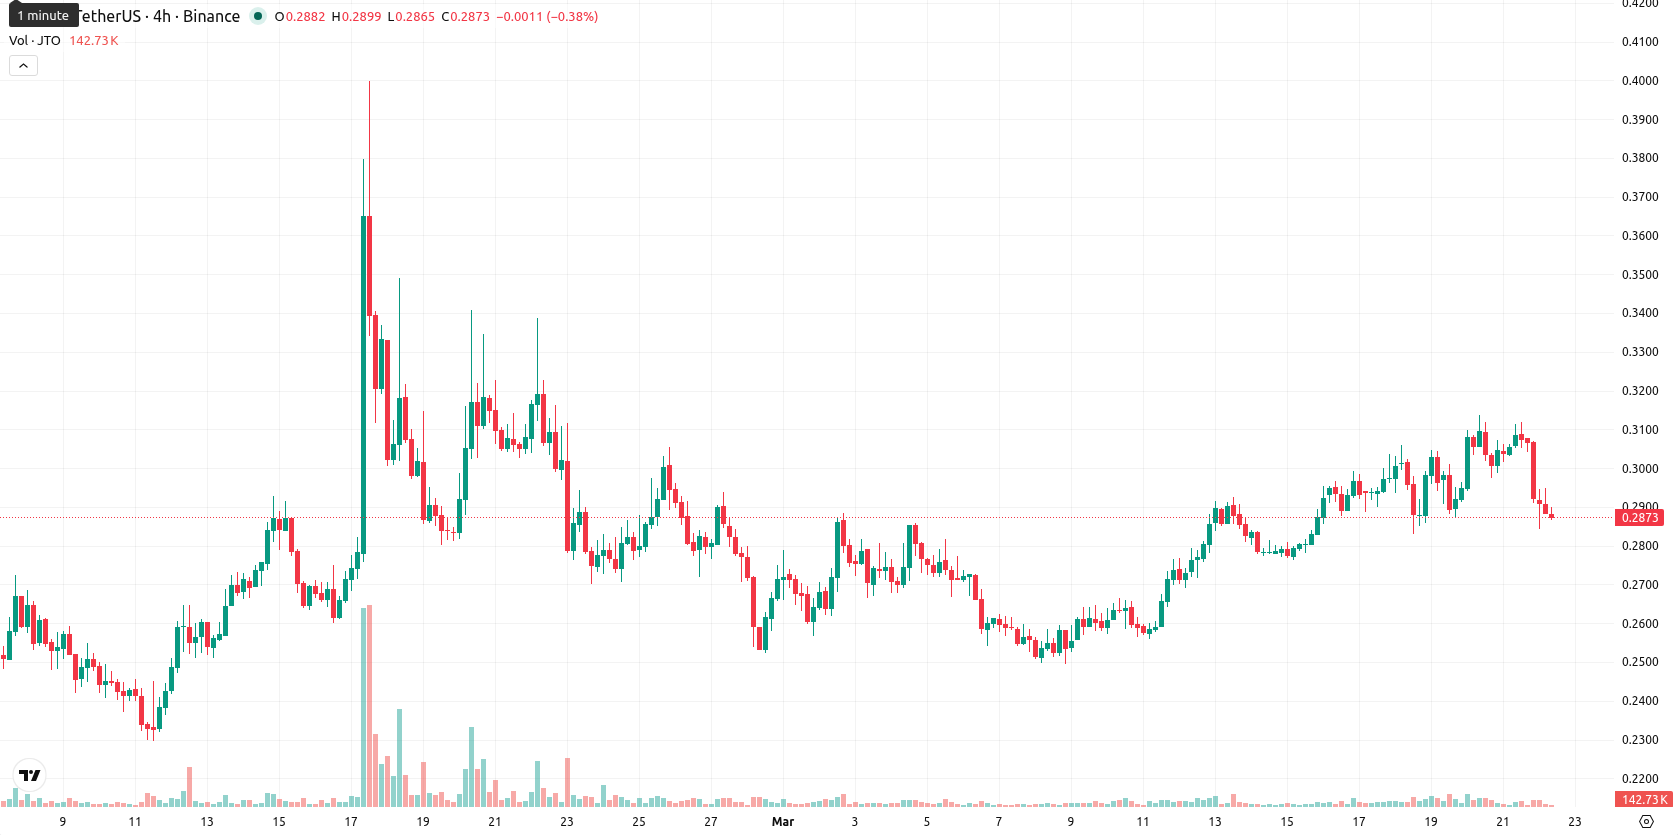
Jito (JTO) is trading at $0.2868, down 7.36% today and positioned above both its SMA-20 ($0.2795) and SMA-50 ($0.2791), yet far below the SMA-200 ($0.7318), reflecting short- to medium-term strength against a weaker long-term trend.
Highlights
- JTO shows conflicting signals with short- and medium-term technical strength but a still-bearish long-term trend structure.
- Intraday volatility is elevated as JTO fell 7.36% after the open, with lower timeframes dominated by sell pressure despite daily bullish cues.
- JTO is expected to consolidate between $0.26 and $0.31 over the next five sessions, with upside probability below 20% and risks skewed to further declines.
Bullish daily momentum tempered by overbought signals and post-open selling
Technical signals show that JTO is supported above its SMA-20 and SMA-50 averages, but remains well below the SMA-200, indicating unresolved long-term weakness. The Ichimoku Kijun at $0.2816 serves as immediate resistance; a move above this level is required for further upside. Momentum indicators are mixed — while daily MACD and ADX suggest moderate bullishness, Stoch RSI (93.8) and CCI (134) are both overbought, with RSI at 58.1 just below the typical overbought threshold. Bull/Bear Power (BBP) on the daily shows slight buyer dominance, the Awesome Oscillator signals short-term upside, but lower timeframes register more pronounced selling momentum as JTO opened weaker and slipped into the lower end of its daily range, highlighting elevated volatility and clear post-open pressure.
Limited upside seen as resistance blocks reversal
In the short term, JTO is likely to fluctuate within a typical volatility band of $0.26 to $0.31, clustering around current levels. A bullish scenario would depend on overcoming immediate resistance at $0.2816 and reclaiming the $0.29 area quickly. A bearish move could develop if JTO closes under $0.26, which may trigger further declines given prevailing negative weekly momentum. The probability of sustained upward movement is low (less than 20%).
Previously it was reported that the Jito Foundation took over SolanaFloor, signaling renewed institutional support for journalism and analytics within the Solana ecosystem. Against this backdrop of ecosystem rebuilding, JTO’s current technical posture emphasizes that traders should closely monitor the $0.26 support level, as a daily close below it could significantly increase downside risk in the near term.


Latest Jito News


-
 Afghanistan
-
 Albania
-
 Algeria
-
 Angola
-
 Argentina
-
 Armenia
-
 Australia
-
 Austria
-
 Azerbaijan
-
 Bahamas
-
 Bahrain
-
 Bangladesh
-
 Belarus
-
 Belgium
-
 Bolivia
-
 Botswana
-
 Brazil
-
 Brunei
-
 Bulgaria
-
 Cambodia
-
 Cameroon
-
 Canada
-
 Chile
Chile
-
 China
China
-
 Colombia
-
 Congo
Congo
-
 Costa Rica
-
 Cote d'Ivoire
-
 Croatia
-
 Cuba
Cuba
-
 Cyprus
-
 Czechia
-
 DR Congo
-
 Denmark
-
 Dominican Republic
-
 Ecuador
-
 Egypt
Egypt
-
 El Salvador
-
 Estonia
-
 Eswatini
-
 Ethiopia
-
 Finland
-
 France
-
 Georgia
-
 Germany
-
 Ghana
Ghana
-
 Greece
-
 Haiti
Haiti
-
 Hong Kong
-
 Hungary
-
 India
India
-
 Indonesia
-
 Iran, Islamic republic
-
 Iraq
Iraq
-
 Ireland
-
 Israel
-
 Italy
Italy
-
 Jamaica
-
 Japan
Japan
-
 Jordan
-
 Kazakhstan
-
 Kenya
Kenya
-
 Korea
Korea
-
 Kuwait
-
 Kyrgyzstan
-
 Laos
Laos
-
 Latvia
-
 Lebanon
-
 Lesotho
-
 Libya
Libya
-
 Lithuania
-
 Luxembourg
-
 Madagascar
-
 Malaysia
-
 Malta
Malta
-
 Mauritius
-
 Mexico
-
 Moldova
-
 Mongolia
-
 Montenegro
-
 Morocco
-
 Mozambique
-
 Myanmar
-
 Namibia
-
 Nepal
Nepal
-
 Netherlands
-
 New Zealand
-
 Nigeria
-
 North Macedonia
-
 Norway
-
 Oman
Oman
-
 Pakistan
-
 Palestine
-
 Panama
-
 Papua New Guinea
-
 Paraguay
-
 Peru
Peru
-
 Philippines
-
 Poland
-
 Portugal
-
 Puerto Rico
-
 Qatar
Qatar
-
 Reunion
-
 Romania
-
 Rwanda
-
 Saudi Arabia
-
 Serbia
-
 Singapore
-
 Slovakia
-
 Slovenia
-
 Somalia
-
 South Africa
-
 Spain
Spain
-
 Sri Lanka
-
 Sweden
-
 Switzerland
-
 Syria
Syria
-
 Taiwan
-
 Tajikistan
-
 Tanzania
-
 Thailand
-
 Trinidad and Tobago
-
 Tunisia
-
 Turkey
-
 UAE
UAE
-
 Uganda
-
 Ukraine
-
 United Kingdom
-
United States
-
 Uruguay
-
 Uzbekistan
-
 Venezuela
-
 Vietnam
-
 Yemen
Yemen
-
 Zambia
-
 Zimbabwe
- Forex
- Crypto
