

Render jumps 7.80% as indicators show buying pressure despite resistance at SMA-200

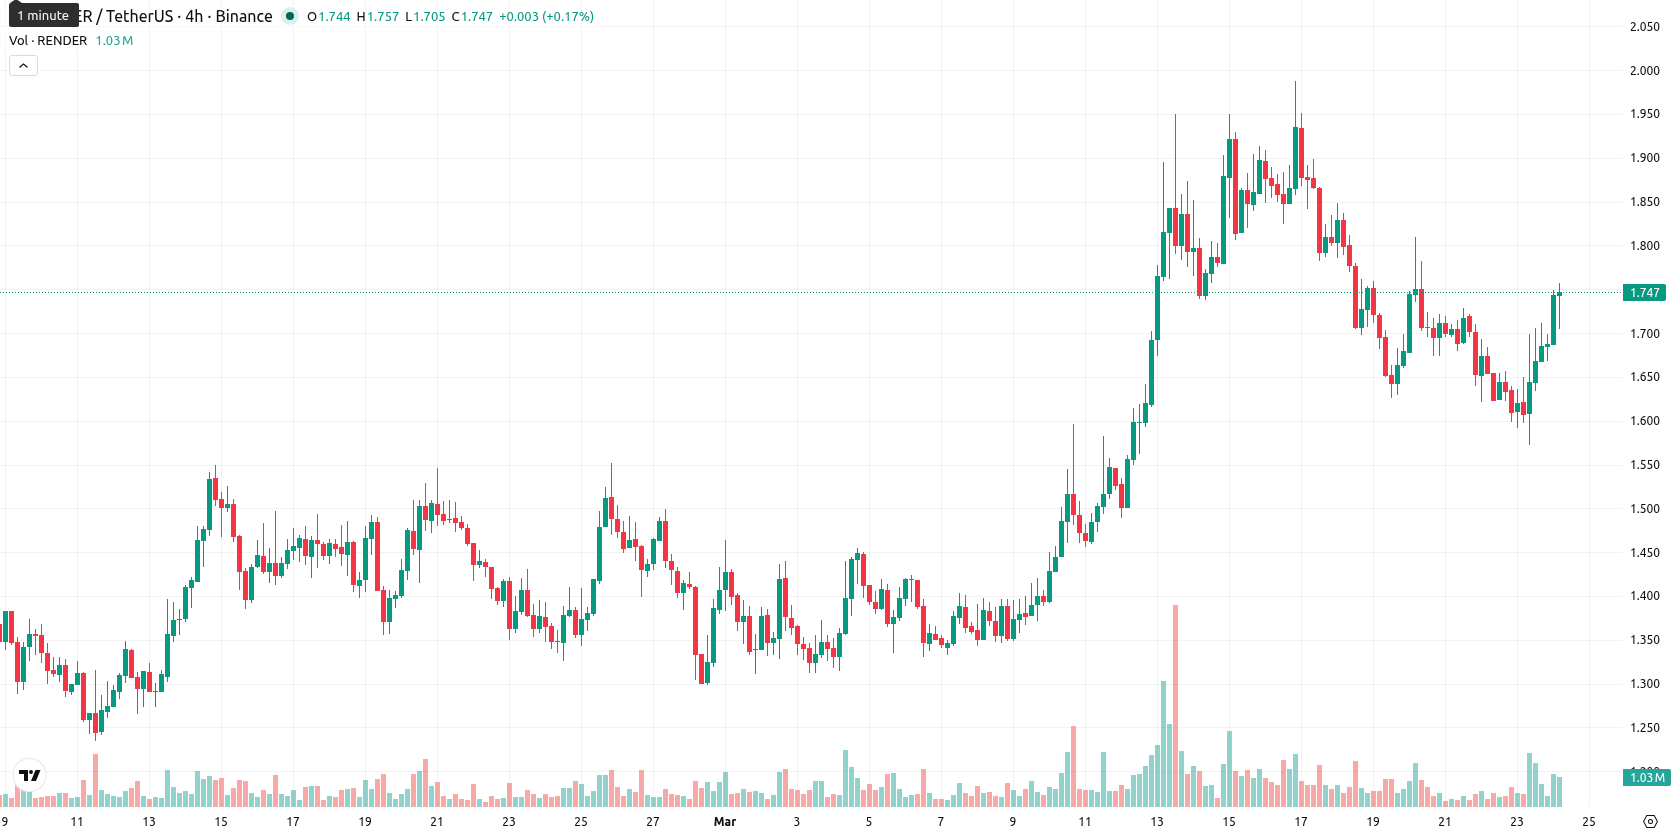
Render (RENDER) is trading at $1.741 after gaining 7.80% intraday, with the price currently positioned above both the SMA-20 ($1.6176) and SMA-50 ($1.4920), but still below the long-term SMA-200 ($2.1407). The Ichimoku Kijun at $1.6430 now acts as immediate support beneath the spot price, reflecting continued short- and medium-term bullish momentum.
 1.4
1.6400
Highlights
- Render exhibits strong bullish short- and medium-term momentum, trading above key moving averages with buyers dominating intraday action.
- Despite current strength, weekly technical indicators signal a bearish bias, with low probability of a sustained upside breakout.
- The projected 5-day trading range is $1.65–$1.87, with price likely consolidating near $1.70–$1.80 unless $1.65 support is breached.
Persistent bullish momentum as volatility rises at session highs
Momentum indicators remain strong on the daily chart for RENDER, with the MACD firmly in a buy zone and the ADX highlighting bullish strength, while the Stoch RSI enters oversold levels and the CCI holds neutral. RSI at 54 supports a modest bullish bias, and BBP is positive, signaling dominant buying pressure intraday. The asset trades close to today's high, showing increased volatility and strength at the session's upper range. Despite the oversold Stoch RSI, the broader suite of momentum and trend signals continues to reinforce underlying bullish conditions.
Sideways consolidation likely as weekly signals turn bearish
In the short term, RENDER is likely to trade within a $1.65 to $1.87 band, consistent with typical volatility relative to current levels. With weekly timeframe signals for MA-50, RSI, ADX, and MACD all on sell or strong sell, odds of another sustained advance are below 20%, making a move lower more probable. The baseline view is for a sideways consolidation around $1.70 – $1.80. Upside above $1.87 could trigger an attempt toward the SMA-200, while a break under $1.65 would suggest further selling pressure.
Earlier, analysts noted that Render faced persistent selling pressure and a prevailing downside bias, with limited near-term upside potential. The latest technical signals now suggest traders should closely monitor the $1.65 support, as a decisive break below this level would increase the risk of a deeper correction.










-
 Afghanistan
-
 Albania
-
 Algeria
-
 Angola
-
 Argentina
-
 Armenia
-
 Australia
-
 Austria
-
 Azerbaijan
-
 Bahamas
-
 Bahrain
-
 Bangladesh
-
 Belarus
-
 Belgium
-
 Bolivia
-
 Botswana
-
 Brazil
-
 Brunei
-
 Bulgaria
-
 Cambodia
-
 Cameroon
-
 Canada
-
 Chile
-
 China
-
 Colombia
-
 Congo
-
 Costa Rica
-
 Cote d'Ivoire
-
 Croatia
-
 Cuba
-
 Cyprus
-
 Czechia
-
 DR Congo
-
 Denmark
-
 Dominican Republic
-
 Ecuador
-
 Egypt
-
 El Salvador
-
 Estonia
-
 Eswatini
-
 Ethiopia
-
 Finland
-
 France
-
 Georgia
-
 Germany
-
 Ghana
-
 Greece
-
 Haiti
-
 Hong Kong
-
 Hungary
-
 India
-
 Indonesia
-
 Iran, Islamic republic
-
 Iraq
-
 Ireland
-
 Israel
-
 Italy
-
 Jamaica
-
 Japan
-
 Jordan
-
 Kazakhstan
-
 Kenya
-
 Korea
-
 Kuwait
-
 Kyrgyzstan
-
 Laos
-
 Latvia
-
 Lebanon
-
 Lesotho
-
 Libya
-
 Lithuania
-
 Luxembourg
-
 Madagascar
-
 Malaysia
-
 Malta
-
 Mauritius
-
 Mexico
-
 Moldova
-
 Mongolia
-
 Montenegro
-
 Morocco
-
 Mozambique
-
 Myanmar
-
 Namibia
-
 Nepal
-
 Netherlands
-
 New Zealand
-
 Nigeria
-
 North Macedonia
-
 Norway
-
 Oman
-
 Pakistan
-
 Palestine
-
 Panama
-
 Papua New Guinea
-
 Paraguay
-
 Peru
-
 Philippines
-
 Poland
-
 Portugal
-
 Puerto Rico
-
 Qatar
-
 Reunion
-
 Romania
-
 Rwanda
-
 Saudi Arabia
-
 Serbia
-
 Singapore
-
 Slovakia
-
 Slovenia
-
 Somalia
-
 South Africa
-
 Spain
-
 Sri Lanka
-
 Sweden
-
 Switzerland
-
 Syria
-
 Taiwan
-
 Tajikistan
-
 Tanzania
-
 Thailand
-
 Trinidad and Tobago
-
 Tunisia
-
 Turkey
-
 UAE
-
 Uganda
-
 Ukraine
-
 United Kingdom
-
United States
-
 Uruguay
-
 Uzbekistan
-
 Venezuela
-
 Vietnam
-
 Yemen
-
 Zambia
-
 Zimbabwe
- Forex
- Crypto












