
Jito price prediction: Volatility band narrows as JTO posts 11.65 percent daily gain

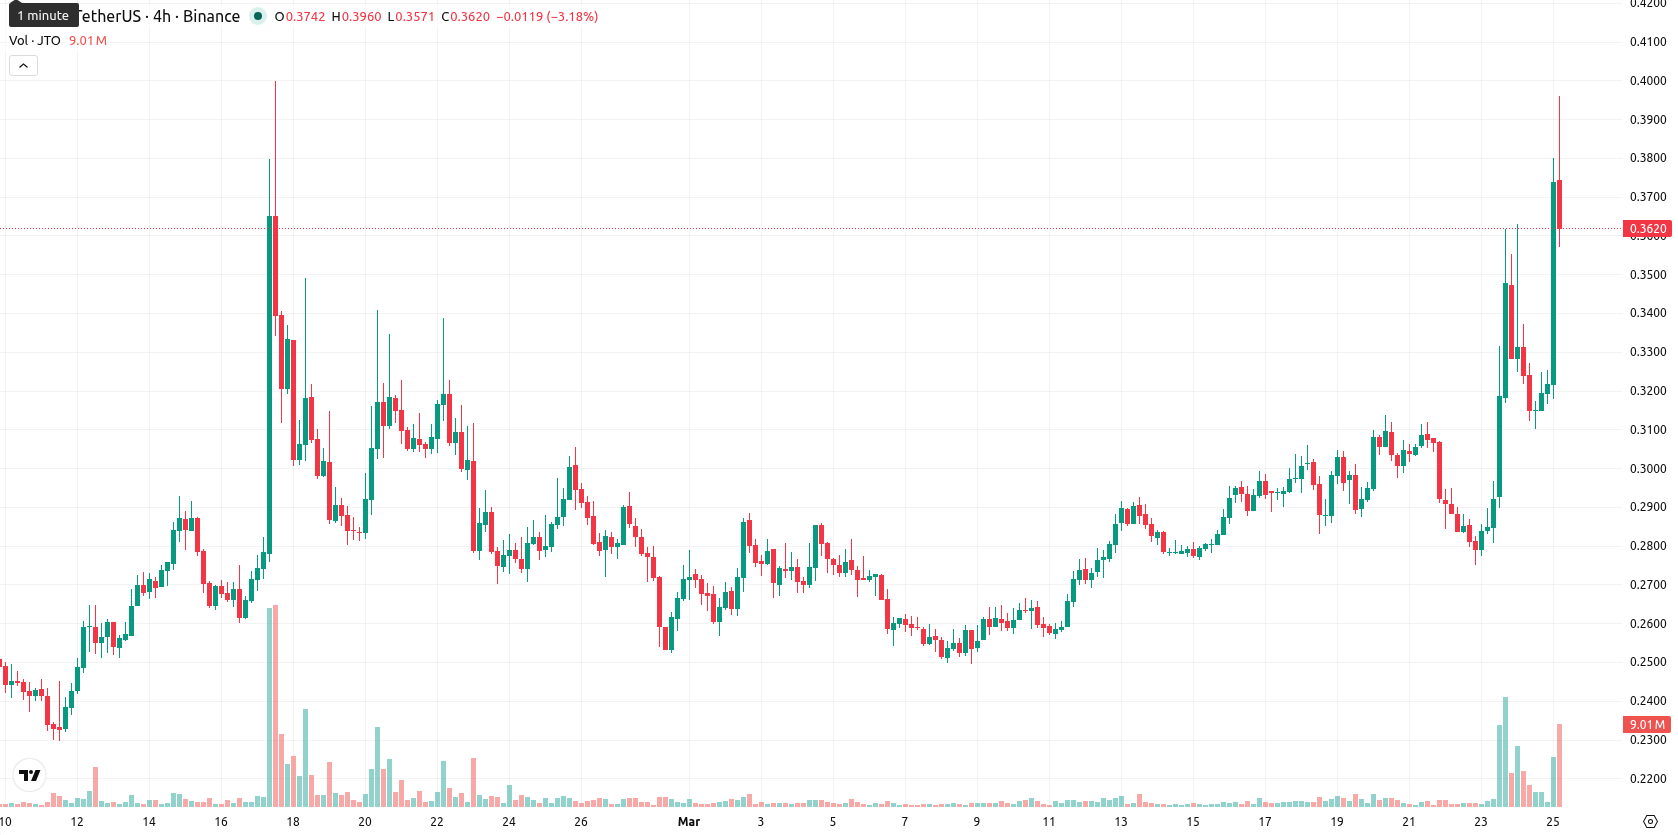
Jito (JTO) is trading at $0.3679, which is well above both the MA-20 ($0.2842) and MA-50 ($0.2796), but remains significantly below the MA-200 ($0.7087). This configuration reflects a robust short- and medium-term bullish structure, but persistent long-term bearish pressure. The Ichimoku Kijun is at $0.3063, now acting as immediate support.
Highlights
- JTO trades well above short- and medium-term averages, reflecting recent strong bullish action despite lingering long-term resistance.
- Momentum indicators confirm upward strength, but several oscillators show overbought conditions, signaling rising risk of a near-term pullback.
- Expected range for the coming week is $0.3300 to $0.4000, with sideways movement likely and a greater probability of decline if mean reversion accelerates.
Bullish momentum seen as overbought signals point to pullback risk
Momentum readings on D1 are firmly bullish, with both ADX and MACD indicating clear upward strength. RSI is positive at 61.5 and still supports further gains, but Stoch RSI (88.6) and CCI (193.8) both flag overbought territory, highlighting risk of a temporary pullback. BBP is in buyer-dominant mode, consistent with strength toward highs. AO also confirms upward momentum. There was a slight gap down at today’s open ($0.3217 vs. prior close at $0.3295), but the price quickly advanced and is holding near the upper end of today’s range ($0.3178–$0.396), indicating high intraday volatility and sustained buying pressure after the open. Note that while momentum signals suggest more upside, several oscillators point to overstretched conditions, introducing the possibility of near-term mean reversion.
Downside favored as weekly indicators point to sell bias
For the next week, a typical volatility band is expected between $0.3300 and $0.4000, keeping movements within ±10% of the current price. Probability of continued gains is very low (less than 20%) based on the strong sell ratings for MA-50-w1, MACD-w1, ADX-w1, and RSI-w1, making a price decline more likely. The baseline scenario expects a sideways corridor between $0.3300 and $0.4000. A bullish breakout would require sustained action above $0.4000, but overbought oscillators and heavy weekly resistance limit this. A bearish scenario could see a drop below $0.3300 if mean reversion intensifies and short-term buyers retreat.
Earlier, analysts noted that Jito maintained strong short- and medium-term momentum despite persistent long-term headwinds. The current technical setup reinforces this view, but with overbought conditions mounting, traders should closely watch the $0.3300 level as a potential inflection point in the coming sessions.


Latest Jito News


-
 Afghanistan
-
 Albania
-
 Algeria
-
 Angola
-
 Argentina
-
 Armenia
-
 Australia
-
 Austria
-
 Azerbaijan
-
 Bahamas
-
 Bahrain
-
 Bangladesh
-
 Belarus
-
 Belgium
-
 Bolivia
-
 Botswana
-
 Brazil
-
 Brunei
-
 Bulgaria
-
 Cambodia
-
 Cameroon
-
 Canada
-
 Chile
Chile
-
 China
China
-
 Colombia
-
 Congo
Congo
-
 Costa Rica
-
 Cote d'Ivoire
-
 Croatia
-
 Cuba
Cuba
-
 Cyprus
-
 Czechia
-
 DR Congo
-
 Denmark
-
 Dominican Republic
-
 Ecuador
-
 Egypt
Egypt
-
 El Salvador
-
 Estonia
-
 Eswatini
-
 Ethiopia
-
 Finland
-
 France
-
 Georgia
-
 Germany
-
 Ghana
Ghana
-
 Greece
-
 Haiti
Haiti
-
 Hong Kong
-
 Hungary
-
 India
India
-
 Indonesia
-
 Iran, Islamic republic
-
 Iraq
Iraq
-
 Ireland
-
 Israel
-
 Italy
Italy
-
 Jamaica
-
 Japan
Japan
-
 Jordan
-
 Kazakhstan
-
 Kenya
Kenya
-
 Korea
Korea
-
 Kuwait
-
 Kyrgyzstan
-
 Laos
Laos
-
 Latvia
-
 Lebanon
-
 Lesotho
-
 Libya
Libya
-
 Lithuania
-
 Luxembourg
-
 Madagascar
-
 Malaysia
-
 Malta
Malta
-
 Mauritius
-
 Mexico
-
 Moldova
-
 Mongolia
-
 Montenegro
-
 Morocco
-
 Mozambique
-
 Myanmar
-
 Namibia
-
 Nepal
Nepal
-
 Netherlands
-
 New Zealand
-
 Nigeria
-
 North Macedonia
-
 Norway
-
 Oman
Oman
-
 Pakistan
-
 Palestine
-
 Panama
-
 Papua New Guinea
-
 Paraguay
-
 Peru
Peru
-
 Philippines
-
 Poland
-
 Portugal
-
 Puerto Rico
-
 Qatar
Qatar
-
 Reunion
-
 Romania
-
 Rwanda
-
 Saudi Arabia
-
 Serbia
-
 Singapore
-
 Slovakia
-
 Slovenia
-
 Somalia
-
 South Africa
-
 Spain
Spain
-
 Sri Lanka
-
 Sweden
-
 Switzerland
-
 Syria
Syria
-
 Taiwan
-
 Tajikistan
-
 Tanzania
-
 Thailand
-
 Trinidad and Tobago
-
 Tunisia
-
 Turkey
-
 UAE
UAE
-
 Uganda
-
 Ukraine
-
 United Kingdom
-
United States
-
 Uruguay
-
 Uzbekistan
-
 Venezuela
-
 Vietnam
-
 Yemen
Yemen
-
 Zambia
-
 Zimbabwe
- Forex
- Crypto
