
-7.53% for Jito as buyers overwhelmed by downward volatility

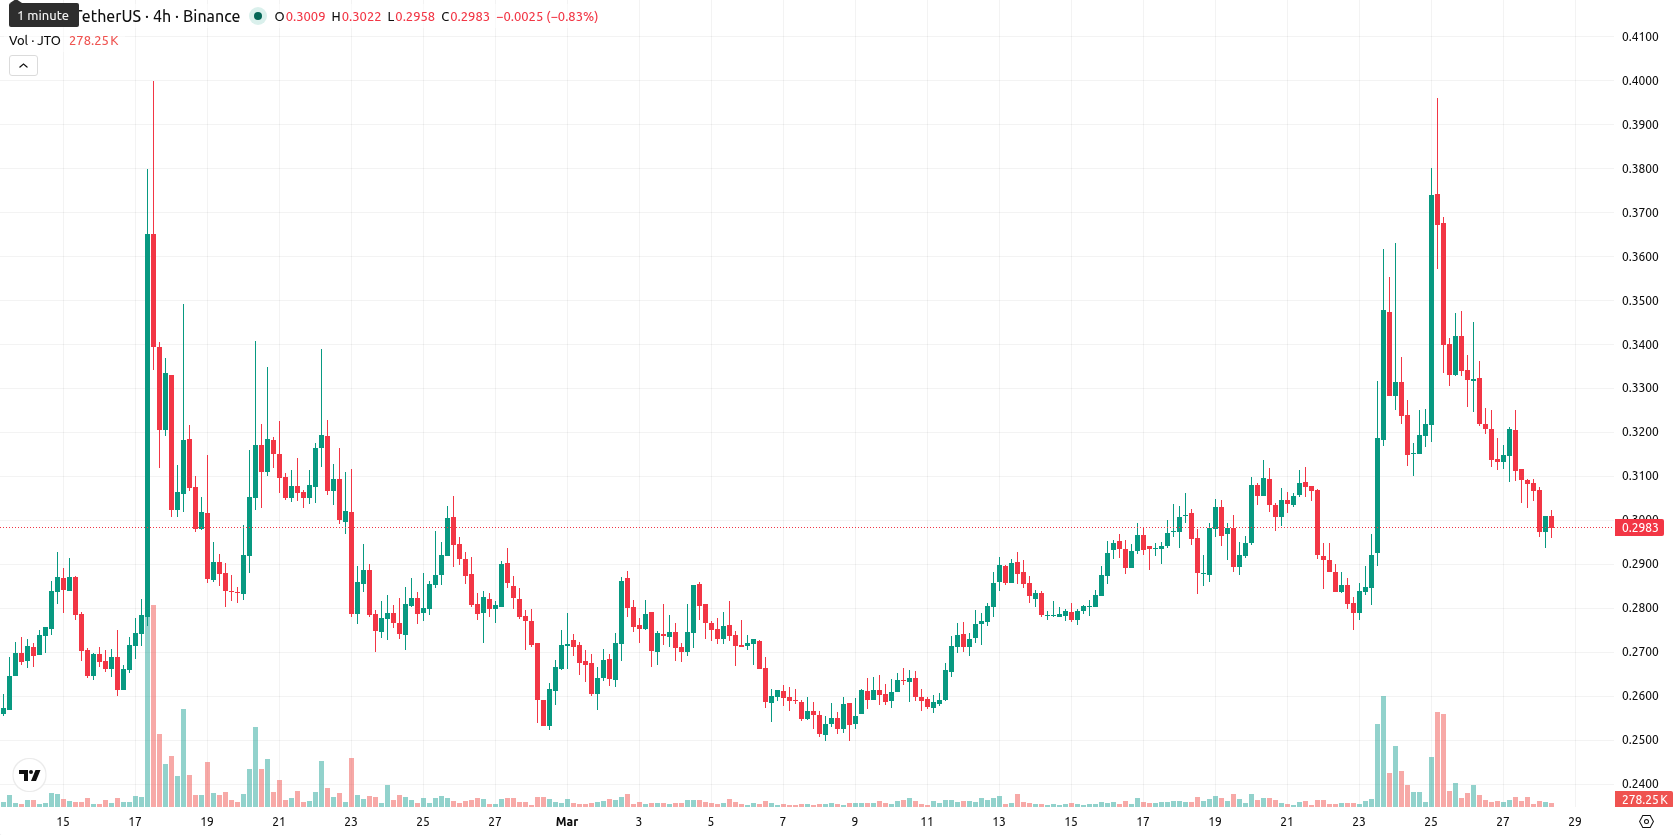
Jito (JTO) is trading at $0.2982, sitting just above the SMA-20 ($0.2924) and SMA-50 ($0.2823), but well below the long-term SMA-200 ($0.6861). This structure signals short- and medium-term support, but persistent long-term bearish pressure. The Ichimoku Kijun at $0.3228 is above the current price, acting as immediate resistance.
Highlights
- JTO faces persistent long-term bearish pressure, trading well below its major long-term average despite short-term support.
- Momentum indicators are mixed with some short-term buying interest, but intraday declines and moderate-to-high volatility signal caution.
- For the next week, JTO is expected to trade between $0.2750 and $0.3100, with a bearish move below $0.2750 more likely than a breakout above resistance.
Diverging momentum signals amid early session price weakness
Momentum readings are mixed. D1 MACD and ADX suggest underlying buyer interest, while daily RSI and CCI are also in buy territory, hinting at modest strength without a clear overbought condition. However, Stoch RSI is neutral and daily BBP flashes a strong buy, indicating buyers dominate short-term action. The Awesome Oscillator is supportive of the current minor uptrend, but intraday price action tells a different story. JTO opened with a small gap down from the previous close and has since declined 7.53%, now trading at the lower end of today's range after early selling pressure. Volatility has been moderate to high, and the tone remains defensive after the open with momentum indicators at odds with the price slide — this divergence suggests caution.
Bearish bias dominates as upside breakout faces major hurdles
For the next five trading days, JTO is expected to fluctuate between $0.2750 and $0.3100. The probability of a significant price increase is very low (less than 20%), making a bearish move far more likely. The baseline scenario is sideways action within this volatility band relative to current levels. A bullish breakout would require reclaiming the $0.3228 resistance area, likely on a surge of buyer momentum and broader market reversal, while a bearish scenario could see the price closing below the $0.2750 support region, aligning with prevailing downward momentum and weak weekly indicators.
Earlier, analysts noted that Jito maintained short- to medium-term resilience, but remained under persistent long-term bearish pressure amid mixed technical signals. The current analysis confirms this outlook, with sustained downside risk prevailing and traders advised to monitor the $0.2750 support level closely for any sign of further weakness.


Latest Jito News


-
 Afghanistan
-
 Albania
-
 Algeria
-
 Angola
-
 Argentina
-
 Armenia
-
 Australia
-
 Austria
-
 Azerbaijan
-
 Bahamas
-
 Bahrain
-
 Bangladesh
-
 Belarus
-
 Belgium
-
 Bolivia
-
 Botswana
-
 Brazil
-
 Brunei
-
 Bulgaria
-
 Cambodia
-
 Cameroon
-
 Canada
-
 Chile
Chile
-
 China
China
-
 Colombia
-
 Congo
Congo
-
 Costa Rica
-
 Cote d'Ivoire
-
 Croatia
-
 Cuba
Cuba
-
 Cyprus
-
 Czechia
-
 DR Congo
-
 Denmark
-
 Dominican Republic
-
 Ecuador
-
 Egypt
Egypt
-
 El Salvador
-
 Estonia
-
 Eswatini
-
 Ethiopia
-
 Finland
-
 France
-
 Georgia
-
 Germany
-
 Ghana
Ghana
-
 Greece
-
 Haiti
Haiti
-
 Hong Kong
-
 Hungary
-
 India
India
-
 Indonesia
-
 Iran, Islamic republic
-
 Iraq
Iraq
-
 Ireland
-
 Israel
-
 Italy
Italy
-
 Jamaica
-
 Japan
Japan
-
 Jordan
-
 Kazakhstan
-
 Kenya
Kenya
-
 Korea
Korea
-
 Kuwait
-
 Kyrgyzstan
-
 Laos
Laos
-
 Latvia
-
 Lebanon
-
 Lesotho
-
 Libya
Libya
-
 Lithuania
-
 Luxembourg
-
 Madagascar
-
 Malaysia
-
 Malta
Malta
-
 Mauritius
-
 Mexico
-
 Moldova
-
 Mongolia
-
 Montenegro
-
 Morocco
-
 Mozambique
-
 Myanmar
-
 Namibia
-
 Nepal
Nepal
-
 Netherlands
-
 New Zealand
-
 Nigeria
-
 North Macedonia
-
 Norway
-
 Oman
Oman
-
 Pakistan
-
 Palestine
-
 Panama
-
 Papua New Guinea
-
 Paraguay
-
 Peru
Peru
-
 Philippines
-
 Poland
-
 Portugal
-
 Puerto Rico
-
 Qatar
Qatar
-
 Reunion
-
 Romania
-
 Rwanda
-
 Saudi Arabia
-
 Serbia
-
 Singapore
-
 Slovakia
-
 Slovenia
-
 Somalia
-
 South Africa
-
 Spain
Spain
-
 Sri Lanka
-
 Sweden
-
 Switzerland
-
 Syria
Syria
-
 Taiwan
-
 Tajikistan
-
 Tanzania
-
 Thailand
-
 Trinidad and Tobago
-
 Tunisia
-
 Turkey
-
 UAE
UAE
-
 Uganda
-
 Ukraine
-
 United Kingdom
-
United States
-
 Uruguay
-
 Uzbekistan
-
 Venezuela
-
 Vietnam
-
 Yemen
Yemen
-
 Zambia
-
 Zimbabwe
- Forex
- Crypto
