
Revised Fed inflation outlook pushes Solana lower

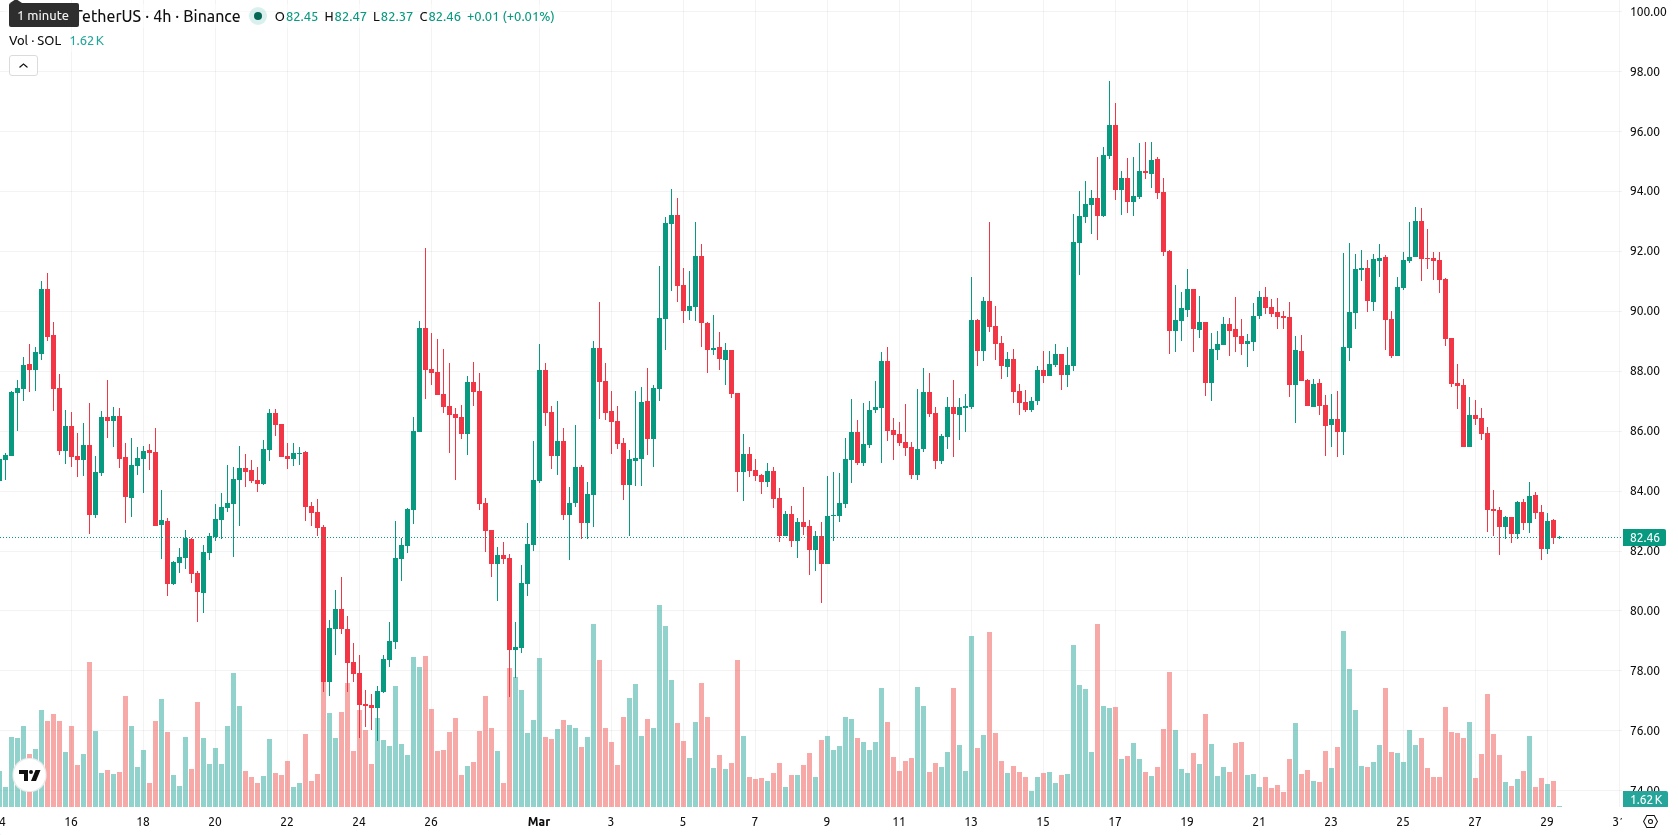
Solana (SOL) is trading at $82.55, below the SMA-20 ($88.60), SMA-50 ($86.08), and well under the SMA-200 ($141.91), confirming a short-, medium-, and long-term bearish bias as sellers maintain pressure across all horizons. The Ichimoku Kijun sits at $88.97, which is above the current price and thus acts as immediate resistance.
Highlights
- Rising geopolitical risks and Iran’s blockade threats have triggered broad outflows from Bitcoin, Ethereum, and Solana spot ETFs, driving risk-off sentiment.
- The Fed’s upward revision of its 2026 inflation forecast and delayed rate cuts strengthened the dollar, intensifying capital flight from crypto assets.
- SOL trades well below key technical levels with oversold momentum signals; a further decline toward $79 is likely as the bearish trend persists.
Crypto ETF outflows intensify as Fed hawkishness and tariffs hit sentiment
The escalation in geopolitical tensions, including Iran's threat to block a second oil chokepoint, has triggered a sharp withdrawal of liquidity from risk assets and contributed directly to coordinated outflows across Solana, Bitcoin, and Ethereum spot ETFs. The US Federal Reserve's decision on March 18 to revise its 2026 PCE inflation forecast upward from 2.4% to 2.7% delayed anticipated rate cuts and led to higher Treasury yields and a stronger US dollar, which accelerated capital flight from crypto assets, including Solana. The persistent global 15% tariff overhang since early 2026 continues to deter institutional risk appetite for digital assets. On March 26, Bitcoin, Ethereum, and Solana spot ETFs all posted simultaneous net outflows for the first time in 2026, intensifying downward price pressure across major cryptocurrencies.
Weak momentum and oversold signals suggest mild divergence risk
Momentum indicators confirm a prevailing bearish tone: both the D1 MACD (-1.18) and ADX (16.96) point to weak downward momentum, with ADX signaling a trend that is not strongly established. RSI (40.39), CCI (-156.95), and Stoch RSI (oversold) all show oversold conditions, while BBP at -3.29 underscores clear seller dominance intraday. The Awesome Oscillator is neutral and does not contradict the prevailing trend. On the day, SOL opened slightly below the previous close (no material gap), slid 1.16%, and trades mid-range between $81.91 and $83.17, reflecting moderate volatility and sustained pressure after the open. This intraday action is consistent with momentum indicators showing continued weakness, while persistently oversold oscillators flag a potential for short-term relief, creating a mild divergence.
Range-bound trading likely as bearish signals and low upside persist
For the next five trading days, SOL is expected to fluctuate between $79 and $86 as adjusted to reflect typical volatility for current conditions. The probability of a price increase is very low (less than 20%), making a further decline much more likely. In the baseline scenario, the price stabilizes and moves sideways within the $79 – $86 corridor. A bullish scenario would require a sustained breakout above the $88 – $89 resistance, but technical signals make this unlikely for now. A bearish scenario could unfold if the price slips under $79, exposing further downside, particularly with both D1 and W1 signals aligned to the downside.
Earlier, analysts noted that Solana remained entrenched in a bearish trend, with persistent selling pressure and weak technical momentum dominating its outlook. Heightened geopolitical risks and renewed macro headwinds now reinforce this bearish scenario, making a move below the $79 level a key downside risk for traders to monitor in the days ahead.


-
 Afghanistan
-
 Albania
-
 Algeria
-
 Angola
-
 Argentina
-
 Armenia
-
 Australia
-
 Austria
-
 Azerbaijan
-
 Bahamas
-
 Bahrain
-
 Bangladesh
-
 Belarus
-
 Belgium
-
 Bolivia
-
 Botswana
-
 Brazil
-
 Brunei
-
 Bulgaria
-
 Cambodia
-
 Cameroon
-
 Canada
-
 Chile
Chile
-
 China
China
-
 Colombia
-
 Congo
Congo
-
 Costa Rica
-
 Cote d'Ivoire
-
 Croatia
-
 Cuba
Cuba
-
 Cyprus
-
 Czechia
-
 DR Congo
-
 Denmark
-
 Dominican Republic
-
 Ecuador
-
 Egypt
Egypt
-
 El Salvador
-
 Estonia
-
 Eswatini
-
 Ethiopia
-
 Finland
-
 France
-
 Georgia
-
 Germany
-
 Ghana
Ghana
-
 Greece
-
 Haiti
Haiti
-
 Hong Kong
-
 Hungary
-
 India
India
-
 Indonesia
-
 Iran, Islamic republic
-
 Iraq
Iraq
-
 Ireland
-
 Israel
-
 Italy
Italy
-
 Jamaica
-
 Japan
Japan
-
 Jordan
-
 Kazakhstan
-
 Kenya
Kenya
-
 Korea
Korea
-
 Kuwait
-
 Kyrgyzstan
-
 Laos
Laos
-
 Latvia
-
 Lebanon
-
 Lesotho
-
 Libya
Libya
-
 Lithuania
-
 Luxembourg
-
 Madagascar
-
 Malaysia
-
 Malta
Malta
-
 Mauritius
-
 Mexico
-
 Moldova
-
 Mongolia
-
 Montenegro
-
 Morocco
-
 Mozambique
-
 Myanmar
-
 Namibia
-
 Nepal
Nepal
-
 Netherlands
-
 New Zealand
-
 Nigeria
-
 North Macedonia
-
 Norway
-
 Oman
Oman
-
 Pakistan
-
 Palestine
-
 Panama
-
 Papua New Guinea
-
 Paraguay
-
 Peru
Peru
-
 Philippines
-
 Poland
-
 Portugal
-
 Puerto Rico
-
 Qatar
Qatar
-
 Reunion
-
 Romania
-
 Rwanda
-
 Saudi Arabia
-
 Serbia
-
 Singapore
-
 Slovakia
-
 Slovenia
-
 Somalia
-
 South Africa
-
 Spain
Spain
-
 Sri Lanka
-
 Sweden
-
 Switzerland
-
 Syria
Syria
-
 Taiwan
-
 Tajikistan
-
 Tanzania
-
 Thailand
-
 Trinidad and Tobago
-
 Tunisia
-
 Turkey
-
 UAE
UAE
-
 Uganda
-
 Ukraine
-
 United Kingdom
-
United States
-
 Uruguay
-
 Uzbekistan
-
 Venezuela
-
 Vietnam
-
 Yemen
Yemen
-
 Zambia
-
 Zimbabwe
- Forex
- Crypto
