
VET up 5.64% as sellers maintain control below $0.00721 resistance: weekly report

VeChain (VET) is trading at $0.007073, having risen $0.0004 (5.64%) over the past week. The asset remains below its weekly MA-20 ($0.00921220), MA-50 ($0.01731208), and MA-200 ($0.02453032), confirming persistent downward pressure and weak price positioning relative to key moving averages.
 0.004843
0.00490700
0.004843
0.00490700
Highlights
- VeChain trades well below key moving averages, confirming persistent medium- and long-term selling pressure.
- Momentum indicators signal a firmly established bearish trend with weak buying interest and no signs of oversold conditions.
- VET is likely to range between $0.00705 and $0.00721 next week, with limited upside probability and heightened risk of further decline.
2026 roadmap upgrade drives sentiment shift as AI integration prioritized
VeChain has outlined its 2026 roadmap, focusing on major upgrades to the VeChainThor blockchain aimed at improving real-world adoption and integration with AI technology. The update will deliver enhanced compatibility with Ethereum tools, increased staking options, interoperability for tokenized assets, and governance advancements. A key feature is the planned introduction of the Model Context Protocol, allowing secure, autonomous AI agent operation on-chain.
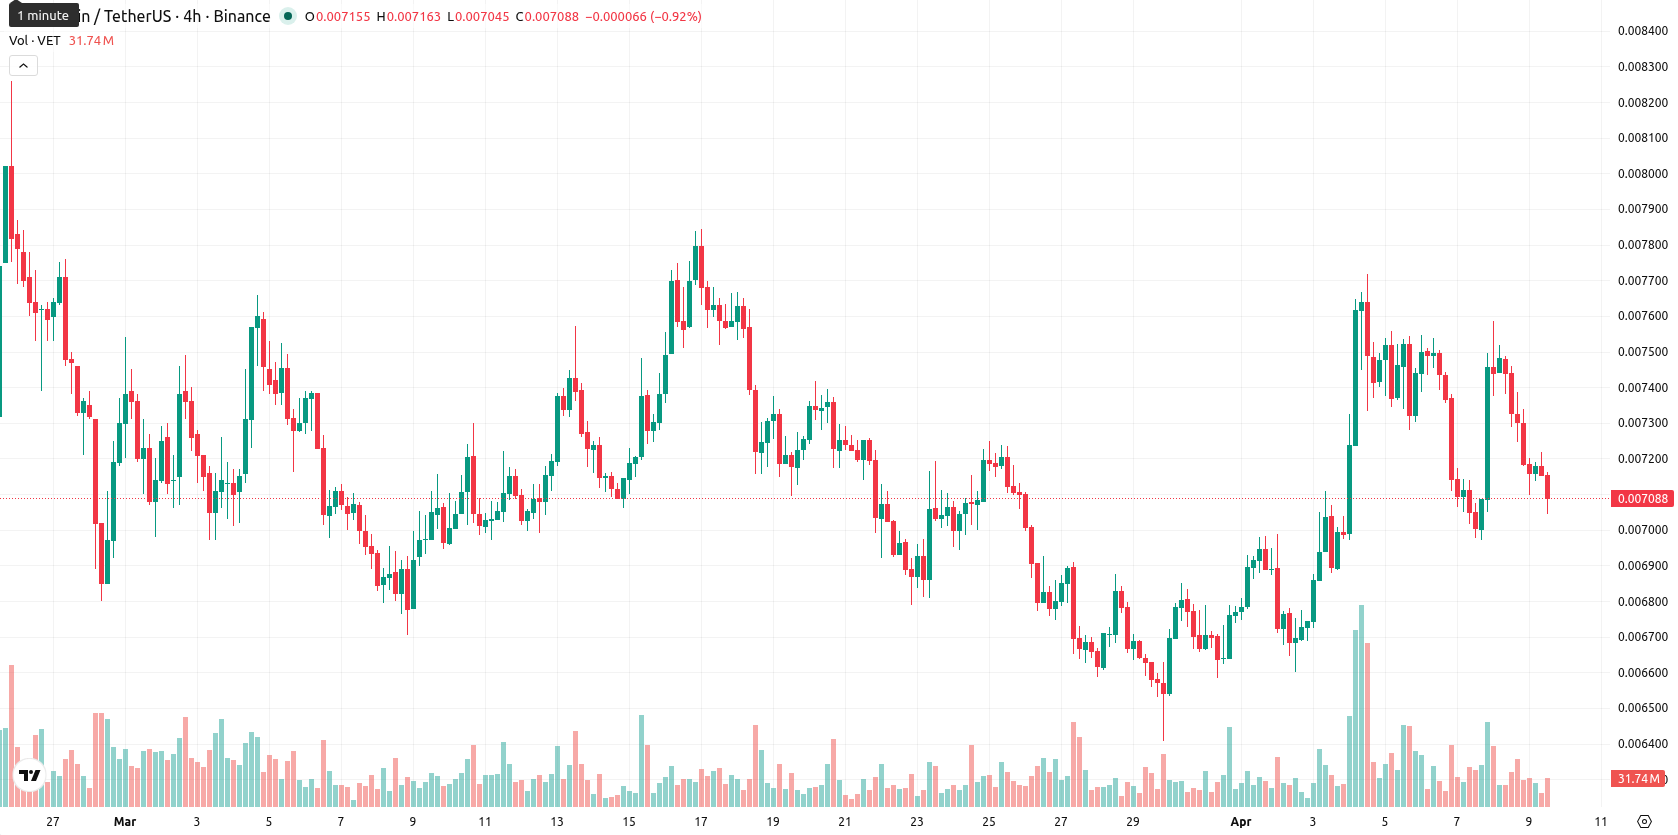
Bearish trend intensifies this week as indicators signal extended weakness
On the weekly chart, VET remains under strong bearish influence with price action well below major moving averages (MA-20, MA-50, MA-200), and the Ichimoku Kijun signaling distant resistance above. Weekly indicators highlight a dominant bear trend, as the MACD and ADX both register sell signals and the RSI is subdued at 31.82, while CCI at -67.68 and negative Bull/Bear Power reinforce the lack of bullish momentum. Despite a slight rebound from recent lows, the coin’s position in the lower range and 14.80% weekly volatility suggest sellers still dominate, with momentum indicators failing to confirm any strong recovery.
Sideways action expected next week as reversal signals remain absent
Over the next 7 days, VET will likely trade sideways within a narrow range between $0.00705 and $0.00721, as none of the main weekly indicators point to a reversal. The probability of a significant upward breakout is low (under 20%), while a move below the $0.00705 support could prompt a retest of longer-term lows. Should the price surge above $0.00721, it would represent a potential shift toward the MA-20, but the prevailing setup supports a base case of further consolidation or renewed weakness.
Earlier, analysts noted that VeChain faced persistent bearish momentum and struggled to establish a clear upside catalyst. The current outlook reinforces this prevailing downtrend, highlighting that traders should monitor for a decisive move above $0.00721 or below $0.00705 as confirmation of the next directional shift.








-
 Afghanistan
-
 Albania
-
 Algeria
-
 Angola
-
 Argentina
-
 Armenia
-
 Australia
-
 Austria
-
 Azerbaijan
-
 Bahamas
-
 Bahrain
-
 Bangladesh
-
 Belarus
-
 Belgium
-
 Bolivia
-
 Botswana
-
 Brazil
-
 Brunei
-
 Bulgaria
-
 Cambodia
-
 Cameroon
-
 Canada
-
 Chile
Chile
-
 China
China
-
 Colombia
-
 Congo
Congo
-
 Costa Rica
-
 Cote d'Ivoire
-
 Croatia
-
 Cuba
Cuba
-
 Cyprus
-
 Czechia
-
 DR Congo
-
 Denmark
-
 Dominican Republic
-
 Ecuador
-
 Egypt
Egypt
-
 El Salvador
-
 Estonia
-
 Eswatini
-
 Ethiopia
-
 Finland
-
 France
-
 Georgia
-
 Germany
-
 Ghana
Ghana
-
 Greece
-
 Haiti
Haiti
-
 Hong Kong
-
 Hungary
-
 India
India
-
 Indonesia
-
 Iran, Islamic republic
-
 Iraq
Iraq
-
 Ireland
-
 Israel
-
 Italy
Italy
-
 Jamaica
-
 Japan
Japan
-
 Jordan
-
 Kazakhstan
-
 Kenya
Kenya
-
 Korea
Korea
-
 Kuwait
-
 Kyrgyzstan
-
 Laos
Laos
-
 Latvia
-
 Lebanon
-
 Lesotho
-
 Libya
Libya
-
 Lithuania
-
 Luxembourg
-
 Madagascar
-
 Malaysia
-
 Malta
Malta
-
 Mauritius
-
 Mexico
-
 Moldova
-
 Mongolia
-
 Montenegro
-
 Morocco
-
 Mozambique
-
 Myanmar
-
 Namibia
-
 Nepal
Nepal
-
 Netherlands
-
 New Zealand
-
 Nigeria
-
 North Macedonia
-
 Norway
-
 Oman
Oman
-
 Pakistan
-
 Palestine
-
 Panama
-
 Papua New Guinea
-
 Paraguay
-
 Peru
Peru
-
 Philippines
-
 Poland
-
 Portugal
-
 Puerto Rico
-
 Qatar
Qatar
-
 Reunion
-
 Romania
-
 Rwanda
-
 Saudi Arabia
-
 Serbia
-
 Singapore
-
 Slovakia
-
 Slovenia
-
 Somalia
-
 South Africa
-
 Spain
Spain
-
 Sri Lanka
-
 Sweden
-
 Switzerland
-
 Syria
Syria
-
 Taiwan
-
 Tajikistan
-
 Tanzania
-
 Thailand
-
 Trinidad and Tobago
-
 Tunisia
-
 Turkey
-
 UAE
UAE
-
 Uganda
-
 Ukraine
-
 United Kingdom
-
United States
-
 Uruguay
-
 Uzbekistan
-
 Venezuela
-
 Vietnam
-
 Yemen
Yemen
-
 Zambia
-
 Zimbabwe
- Forex
- Crypto











