
Jito price prediction: Will $0.3249 resistance cap gains as JTO jumps 7.18%?

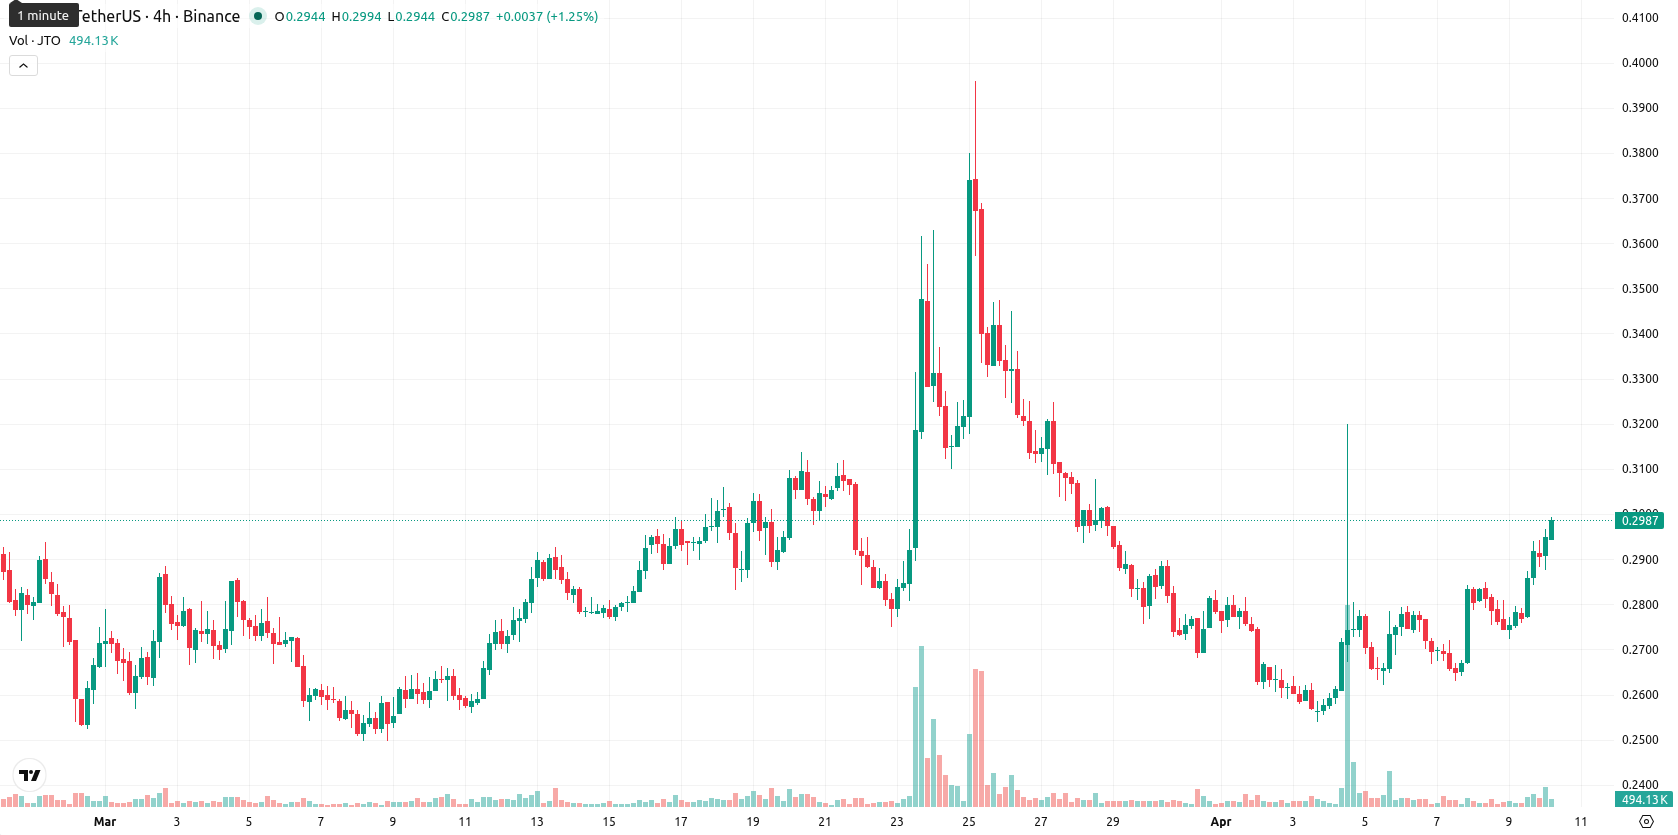
Jito (JTO) is trading at $0.2969, positioned above both the SMA-20 ($0.2884) and SMA-50 ($0.2842) but remains well below the distant SMA-200 ($0.5800), signaling a short-term bullish bias with ongoing long-term downward pressure. The Ichimoku Kijun level at $0.3249 is above the current price, marking this as immediate resistance.
Highlights
- JTO trades in a short-term bullish pattern above key averages, yet remains pressured by a weak long-term trend.
- Momentum signals are mixed, combining intraday buying strength with overbought and oscillator divergence warnings that suggest caution.
- Price is expected to range between $0.2860 and $0.3060 over five sessions, with upside capped below $0.3249 resistance and a higher risk of decline if support fails.
Divergent technical signals as intraday bulls face overbought risks
Momentum on the daily timeframe is mixed: ADX (24.4) points to a developing trend, but conflicting signals emerge as the MACD suggests strong selling while RSI (51.9) is neutral-bullish and Stoch RSI flags overbought conditions. BBP provides a “Strong Buy” signal, indicating buyers are presently in control of intraday movement. The current session saw no significant opening gap, with the price now trading near the upper end of today’s range ($0.2875 – $0.2989) following a strong daily gain of 7.18% and marked by moderate volatility and upward pressure since the open. Oscillator divergence and overbought alerts suggest caution, as short-term upside momentum may be stretched despite intraday strength.
Bearish outlook persists as low breakout odds weigh on JTO
Over the next 5 sessions, JTO is expected to fluctuate within a volatility band of $0.2860 – $0.3060, or ±3% of current levels, given ongoing market volatility. All major weekly indicators remain bearish, and the probability of a sustained price increase is low (less than 20%), suggesting a further decrease is more likely. The baseline scenario sees price ranging sideways below resistance at $0.3249, while any breakout above this level could trigger further gains. On the downside, loss of support near $0.2880 may prompt additional declines.
Earlier, analysts noted that Jito maintained short-term resilience but faced persistent long-term bearish pressure amid mixed technical indicators. The current analysis reinforces this cautious outlook, with fresh overbought signals and oscillator divergence highlighting ongoing downside risk and making the $0.2880 support level essential to monitor for any shift in market direction.


Latest Jito News


-
 Afghanistan
-
 Albania
-
 Algeria
-
 Angola
-
 Argentina
-
 Armenia
-
 Australia
-
 Austria
-
 Azerbaijan
-
 Bahamas
-
 Bahrain
-
 Bangladesh
-
 Belarus
-
 Belgium
-
 Bolivia
-
 Botswana
-
 Brazil
-
 Brunei
-
 Bulgaria
-
 Cambodia
-
 Cameroon
-
 Canada
-
 Chile
Chile
-
 China
China
-
 Colombia
-
 Congo
Congo
-
 Costa Rica
-
 Cote d'Ivoire
-
 Croatia
-
 Cuba
Cuba
-
 Cyprus
-
 Czechia
-
 DR Congo
-
 Denmark
-
 Dominican Republic
-
 Ecuador
-
 Egypt
Egypt
-
 El Salvador
-
 Estonia
-
 Eswatini
-
 Ethiopia
-
 Finland
-
 France
-
 Georgia
-
 Germany
-
 Ghana
Ghana
-
 Greece
-
 Haiti
Haiti
-
 Hong Kong
-
 Hungary
-
 India
India
-
 Indonesia
-
 Iran, Islamic republic
-
 Iraq
Iraq
-
 Ireland
-
 Israel
-
 Italy
Italy
-
 Jamaica
-
 Japan
Japan
-
 Jordan
-
 Kazakhstan
-
 Kenya
Kenya
-
 Korea
Korea
-
 Kuwait
-
 Kyrgyzstan
-
 Laos
Laos
-
 Latvia
-
 Lebanon
-
 Lesotho
-
 Libya
Libya
-
 Lithuania
-
 Luxembourg
-
 Madagascar
-
 Malaysia
-
 Malta
Malta
-
 Mauritius
-
 Mexico
-
 Moldova
-
 Mongolia
-
 Montenegro
-
 Morocco
-
 Mozambique
-
 Myanmar
-
 Namibia
-
 Nepal
Nepal
-
 Netherlands
-
 New Zealand
-
 Nigeria
-
 North Macedonia
-
 Norway
-
 Oman
Oman
-
 Pakistan
-
 Palestine
-
 Panama
-
 Papua New Guinea
-
 Paraguay
-
 Peru
Peru
-
 Philippines
-
 Poland
-
 Portugal
-
 Puerto Rico
-
 Qatar
Qatar
-
 Reunion
-
 Romania
-
 Rwanda
-
 Saudi Arabia
-
 Serbia
-
 Singapore
-
 Slovakia
-
 Slovenia
-
 Somalia
-
 South Africa
-
 Spain
Spain
-
 Sri Lanka
-
 Sweden
-
 Switzerland
-
 Syria
Syria
-
 Taiwan
-
 Tajikistan
-
 Tanzania
-
 Thailand
-
 Trinidad and Tobago
-
 Tunisia
-
 Turkey
-
 UAE
UAE
-
 Uganda
-
 Ukraine
-
 United Kingdom
-
United States
-
 Uruguay
-
 Uzbekistan
-
 Venezuela
-
 Vietnam
-
 Yemen
Yemen
-
 Zambia
-
 Zimbabwe
- Forex
- Crypto
