
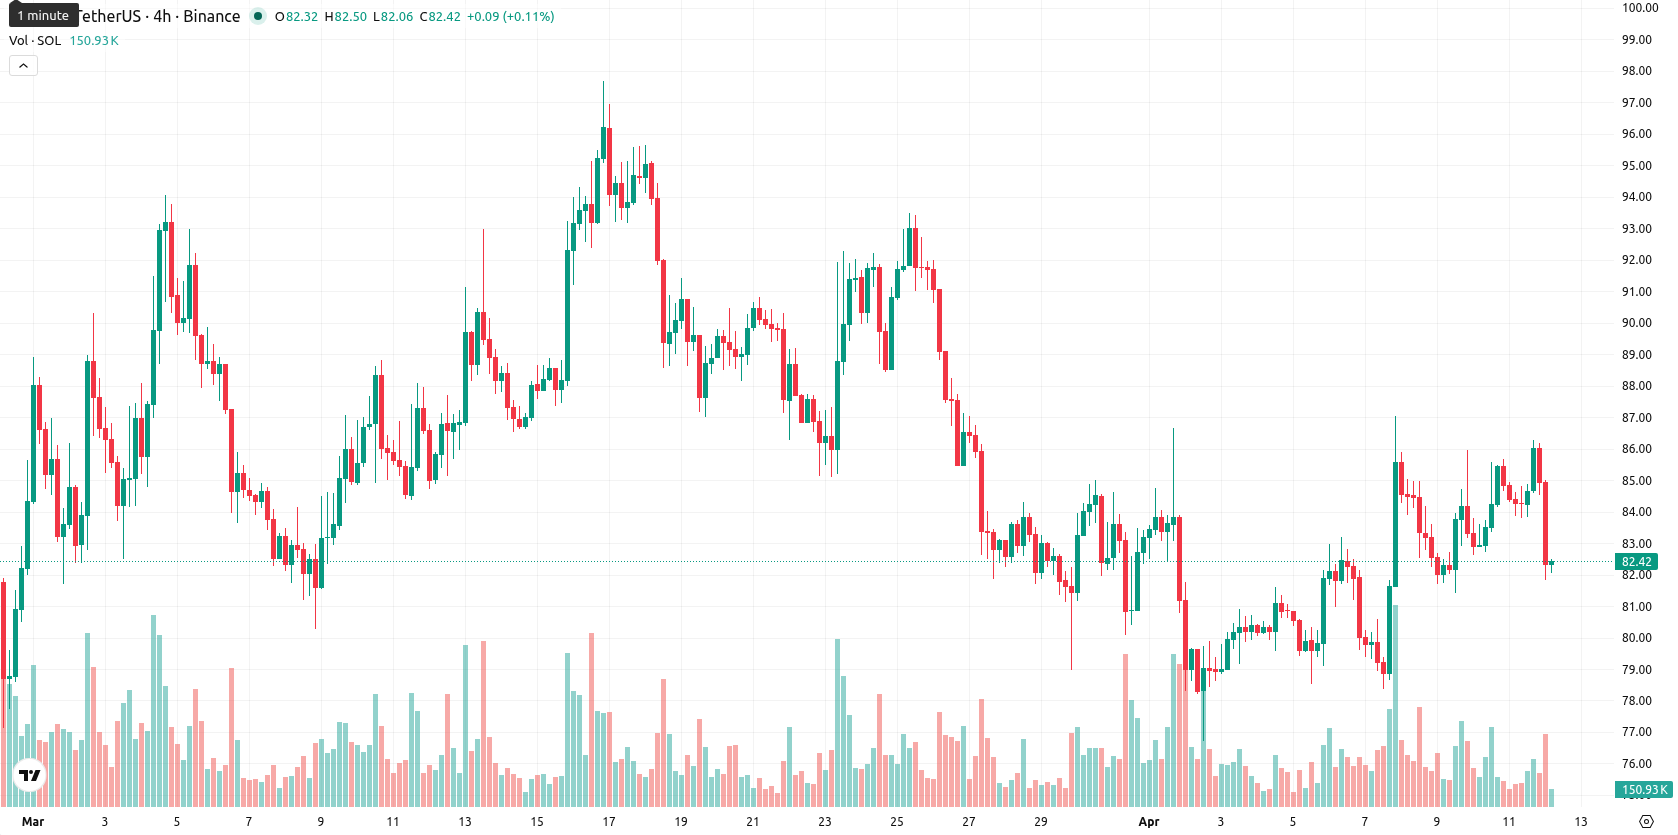
Solana price prediction: Trouble at $81.00–$84.50 range? SOL falls 2.01%

Solana (SOL) is trading at $82.40, below its MA-20 ($83.87), MA-50 ($85.50), and far below its MA-200 ($131.23), indicating short-term and medium-term pressure from sellers and a weak longer-term structure. The Ichimoku Kijun on D1 is $86.83, which sits above the current price and acts as immediate resistance.
Highlights
- Solana's total value locked reached $5.2 billion in June, up 10% month-on-month, supported by Jupiter and Raydium activity.
- SOL maintains a $48.55 billion market cap with circulating supply near 470 million, but faces ongoing broad-based selling pressure.
- SOL is trading below key technical levels, with bearish momentum signals and an expected five-day range of $81.00 to $84.50 amid downside risk.
Rising network activity counters persistent price weakness amid heavy trading
Total value locked (TVL) on the Solana network was reported at $5.2 billion, reflecting a 10% monthly increase, with DeFi activity led by Jupiter and Raydium. Daily trading volume reached $13.57 billion, which was four times the monthly average. Market capitalization stood at $48.55 billion alongside a circulating supply of 470 million out of a total 582 million SOL, though price action has remained under broader selling pressure.
Bearish momentum prevails as technical signals align to downside
Momentum indicators are bearish, with MACD on D1 and W1 both showing strong sell signals and ADX on D1 at 14.43 suggesting a weak and indecisive trend, while W1 ADX remains on sell. RSI sits in neutral territory on D1 at 50.79 but points to selling on W1 at 34.33, and Stoch RSI is overbought on D1, suggesting potential for downside reversal. BBP is in the overbought area (2.63), showing buyers recently dominated, yet the daily change is a decline of 2.01% with the price near today’s low of $81.98 — there was a slight gap up at the open, followed by steady downward pressure and moderate volatility. Intraday tone leans negative as momentum signals broadly align to the downside despite minor overbought readings.
Sideways range likely as bearish indicators limit upside prospects
For the next five trading days, the expected range is $81.00 to $84.50, clustered near the current price and reflecting subdued volatility. There is a very low probability (less than 20%) of a price increase, with continued declines much more likely given persistent bearish signals across D1 and W1 for MA, MACD, ADX, and RSI. Baseline scenario: SOL fluctuates sideways between $81.00 and $84.50. A bullish scenario would require breaking above the immediate resistance at $86.83, targeting further upside, but such an outcome is unlikely without a sharp momentum shift. The bearish scenario — breaking below $81.00 — would expose further weakness toward lower support levels, supported by prevailing trend and momentum indicators.
Earlier, analysts noted that Solana faced ongoing regulatory uncertainty and mixed technical signals, favoring a period of price consolidation over a near-term breakout. The latest developments reinforce this view, as bearish momentum persists and traders should monitor the $81.00 support level for signs of further downside risk.


Latest Solana News


-
 Afghanistan
-
 Albania
-
 Algeria
-
 Angola
-
 Argentina
-
 Armenia
-
 Australia
-
 Austria
-
 Azerbaijan
-
 Bahamas
-
 Bahrain
-
 Bangladesh
-
 Belarus
-
 Belgium
-
 Bolivia
-
 Botswana
-
 Brazil
-
 Brunei
-
 Bulgaria
-
 Cambodia
-
 Cameroon
-
 Canada
-
 Chile
Chile
-
 China
China
-
 Colombia
-
 Congo
Congo
-
 Costa Rica
-
 Cote d'Ivoire
-
 Croatia
-
 Cuba
Cuba
-
 Cyprus
-
 Czechia
-
 DR Congo
-
 Denmark
-
 Dominican Republic
-
 Ecuador
-
 Egypt
Egypt
-
 El Salvador
-
 Estonia
-
 Eswatini
-
 Ethiopia
-
 Finland
-
 France
-
 Georgia
-
 Germany
-
 Ghana
Ghana
-
 Greece
-
 Haiti
Haiti
-
 Hong Kong
-
 Hungary
-
 India
India
-
 Indonesia
-
 Iran, Islamic republic
-
 Iraq
Iraq
-
 Ireland
-
 Israel
-
 Italy
Italy
-
 Jamaica
-
 Japan
Japan
-
 Jordan
-
 Kazakhstan
-
 Kenya
Kenya
-
 Korea
Korea
-
 Kuwait
-
 Kyrgyzstan
-
 Laos
Laos
-
 Latvia
-
 Lebanon
-
 Lesotho
-
 Libya
Libya
-
 Lithuania
-
 Luxembourg
-
 Madagascar
-
 Malaysia
-
 Malta
Malta
-
 Mauritius
-
 Mexico
-
 Moldova
-
 Mongolia
-
 Montenegro
-
 Morocco
-
 Mozambique
-
 Myanmar
-
 Namibia
-
 Nepal
Nepal
-
 Netherlands
-
 New Zealand
-
 Nigeria
-
 North Macedonia
-
 Norway
-
 Oman
Oman
-
 Pakistan
-
 Palestine
-
 Panama
-
 Papua New Guinea
-
 Paraguay
-
 Peru
Peru
-
 Philippines
-
 Poland
-
 Portugal
-
 Puerto Rico
-
 Qatar
Qatar
-
 Reunion
-
 Romania
-
 Rwanda
-
 Saudi Arabia
-
 Serbia
-
 Singapore
-
 Slovakia
-
 Slovenia
-
 Somalia
-
 South Africa
-
 Spain
Spain
-
 Sri Lanka
-
 Sweden
-
 Switzerland
-
 Syria
Syria
-
 Taiwan
-
 Tajikistan
-
 Tanzania
-
 Thailand
-
 Trinidad and Tobago
-
 Tunisia
-
 Turkey
-
 UAE
UAE
-
 Uganda
-
 Ukraine
-
 United Kingdom
-
United States
-
 Uruguay
-
 Uzbekistan
-
 Venezuela
-
 Vietnam
-
 Yemen
Yemen
-
 Zambia
-
 Zimbabwe
- Forex
- Crypto
