
Flow ticks up as buyers show signs of exhaustion after rapid move

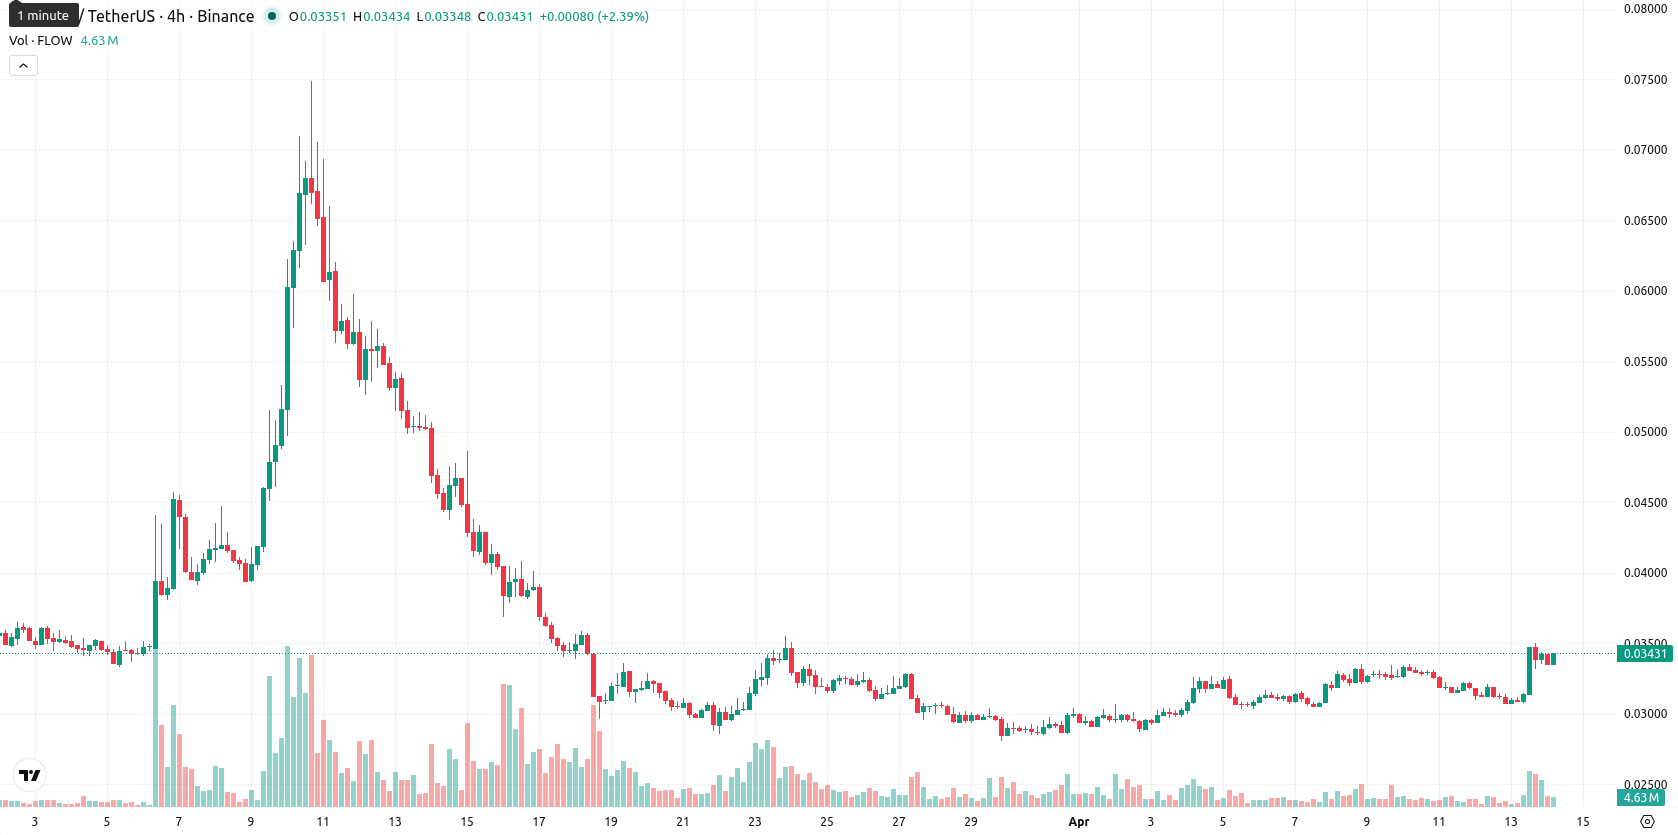
Flow (FLOW) is trading at $0.034, marking a daily gain of 10.13%. The asset sits above its MA-20 ($0.0311) but remains below both the MA-50 ($0.0360) and MA-200 ($0.1475), highlighting short-term bullish momentum with ongoing medium- and long-term resistance.
Highlights
- FLOW shows short-term bullish momentum, currently trading above its 20-day moving average but still below longer-term resistance levels.
- Momentum indicators are mixed, with overbought signals and weak trend strength suggesting limited upside potential in the near term.
- Expected five-day price action is likely constrained within $0.031 to $0.037, with less than 20% probability of a sustained upward breakout.
Buyer exhaustion signals as daily strength clashes with weak momentum
Technically, FLOW shows mixed momentum. The Ichimoku Kijun at $0.0318 is acting as immediate support, while MA-50 and MA-200 still create overhead pressure. D1 MACD signals a strong sell, ADX remains neutral and weak, and the RSI is mildly bullish at 52.7. Stoch RSI and CCI indicating overbought, while BBP signals strong buyer dominance — the combination points to near-term exhaustion, highlighting a disconnect between daily strength and lagging momentum.
Sideways movement expected as breakout prospects remain limited
In the short term, FLOW is expected to move within a $0.031 to $0.037 volatility band relative to current levels over the next five trading days. With major weekly trend indicators remaining neutral or bearish, the probability of a sustained rally remains very low — below 20%. The base scenario is a sideways consolidation between immediate support and resistance levels. Upside potential requires a breakout above $0.037, while a close below $0.0318 could trigger renewed declines.
Earlier, analysts noted that Flow was facing persistent bearish momentum amid cautious trader sentiment. The current technical setup introduces short-term bullish signals within an overall neutral-to-bearish backdrop, so traders should monitor for a potential break above $0.037 or a reversal if support fails at $0.0318.


Latest FLOW News


-
 Afghanistan
-
 Albania
-
 Algeria
-
 Angola
-
 Argentina
-
 Armenia
-
 Australia
-
 Austria
-
 Azerbaijan
-
 Bahamas
-
 Bahrain
-
 Bangladesh
-
 Belarus
-
 Belgium
-
 Bolivia
-
 Botswana
-
 Brazil
-
 Brunei
-
 Bulgaria
-
 Cambodia
-
 Cameroon
-
 Canada
-
 Chile
Chile
-
 China
China
-
 Colombia
-
 Congo
Congo
-
 Costa Rica
-
 Cote d'Ivoire
-
 Croatia
-
 Cuba
Cuba
-
 Cyprus
-
 Czechia
-
 DR Congo
-
 Denmark
-
 Dominican Republic
-
 Ecuador
-
 Egypt
Egypt
-
 El Salvador
-
 Estonia
-
 Eswatini
-
 Ethiopia
-
 Finland
-
 France
-
 Georgia
-
 Germany
-
 Ghana
Ghana
-
 Greece
-
 Haiti
Haiti
-
 Hong Kong
-
 Hungary
-
 India
India
-
 Indonesia
-
 Iran, Islamic republic
-
 Iraq
Iraq
-
 Ireland
-
 Israel
-
 Italy
Italy
-
 Jamaica
-
 Japan
Japan
-
 Jordan
-
 Kazakhstan
-
 Kenya
Kenya
-
 Korea
Korea
-
 Kuwait
-
 Kyrgyzstan
-
 Laos
Laos
-
 Latvia
-
 Lebanon
-
 Lesotho
-
 Libya
Libya
-
 Lithuania
-
 Luxembourg
-
 Madagascar
-
 Malaysia
-
 Malta
Malta
-
 Mauritius
-
 Mexico
-
 Moldova
-
 Mongolia
-
 Montenegro
-
 Morocco
-
 Mozambique
-
 Myanmar
-
 Namibia
-
 Nepal
Nepal
-
 Netherlands
-
 New Zealand
-
 Nigeria
-
 North Macedonia
-
 Norway
-
 Oman
Oman
-
 Pakistan
-
 Palestine
-
 Panama
-
 Papua New Guinea
-
 Paraguay
-
 Peru
Peru
-
 Philippines
-
 Poland
-
 Portugal
-
 Puerto Rico
-
 Qatar
Qatar
-
 Reunion
-
 Romania
-
 Rwanda
-
 Saudi Arabia
-
 Serbia
-
 Singapore
-
 Slovakia
-
 Slovenia
-
 Somalia
-
 South Africa
-
 Spain
Spain
-
 Sri Lanka
-
 Sweden
-
 Switzerland
-
 Syria
Syria
-
 Taiwan
-
 Tajikistan
-
 Tanzania
-
 Thailand
-
 Trinidad and Tobago
-
 Tunisia
-
 Turkey
-
 UAE
UAE
-
 Uganda
-
 Ukraine
-
 United Kingdom
-
United States
-
 Uruguay
-
 Uzbekistan
-
 Venezuela
-
 Vietnam
-
 Yemen
Yemen
-
 Zambia
-
 Zimbabwe
- Forex
- Crypto
