
Pepe trades higher as price levels remain well below the long-term average

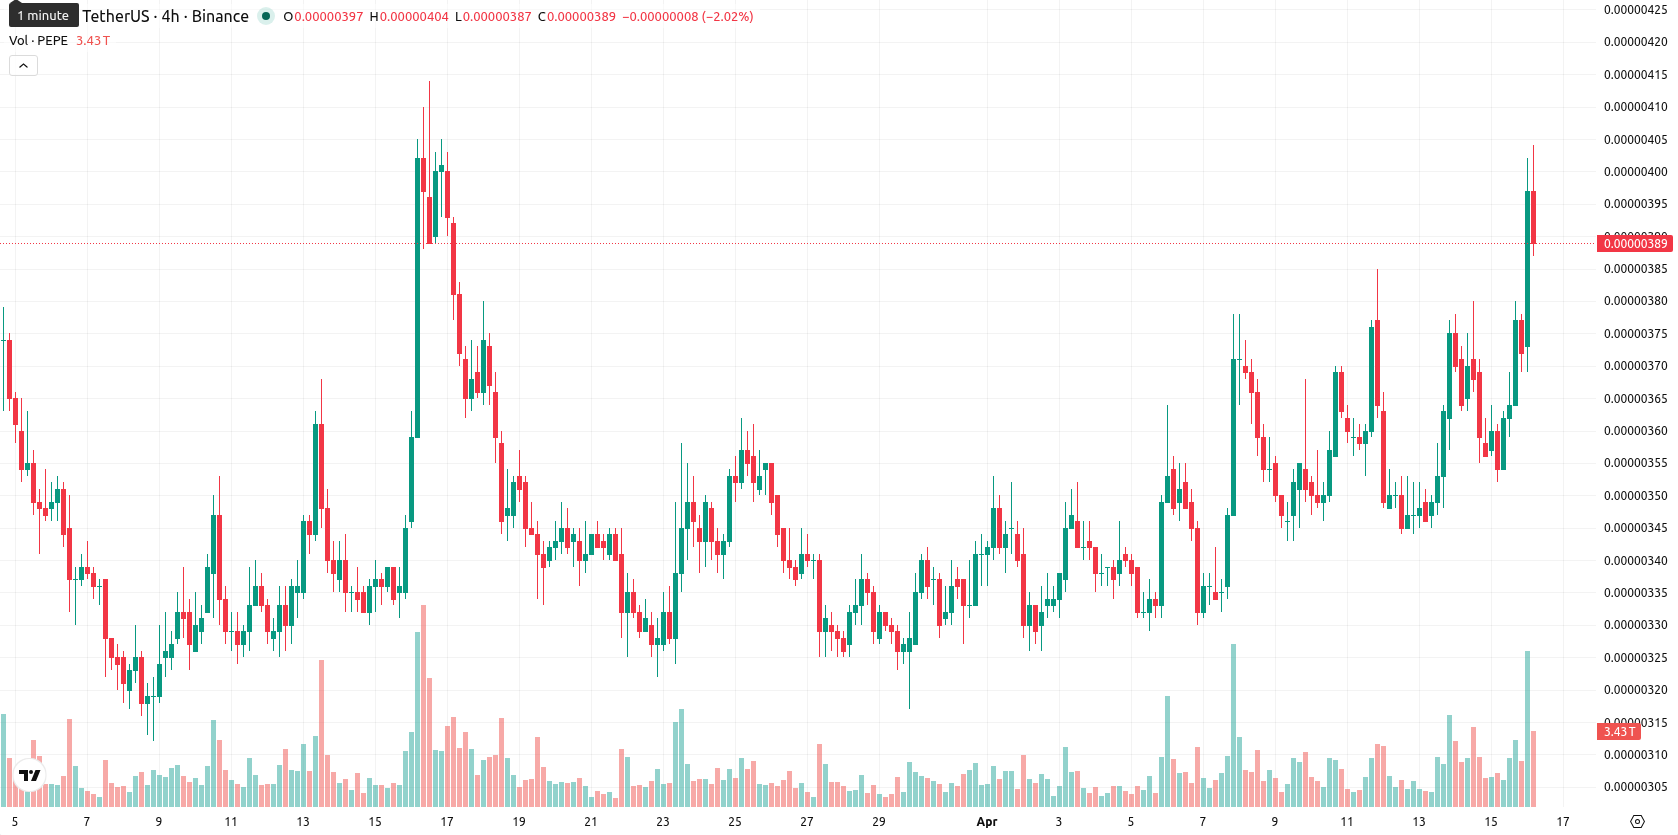
Pepe (PEPE) is trading at $0.0000039, up 8.66% on the day and maintaining levels above both its 20-day ($0.000003474) and 50-day ($0.000003483) simple moving averages, signaling short- and medium-term bullish momentum. The price still sits below the longer-term SMA-200 at $0.000005016.
 0.0528
80
0.0528
0.052880
Highlights
- PEPE shows short- and medium-term bullish momentum but faces long-term resistance, with price still below key averages.
- Momentum and oscillator indicators signal strong buyer dominance and overbought conditions, indicating a stretched rally and risk of near-term cooling.
- Projected five-day trading range is $0.00000395 to $0.00000438, with consolidation likely and bearish risk if support fails.
Overbought signals emerge despite persistent bullish momentum and resistance
Price action in PEPE shows momentum remains positive as it stays above the SMA-20 and SMA-50, with immediate support from the Ichimoku Kijun at $0.000003510. Despite persistent resistance below the SMA-200, daily indicators reflect strong buying sentiment: MACD issues a buy signal, ADX on D1 is neutral, and RSI stands in bullish territory at 55.6. CCI and Stoch RSI are both overbought, suggesting the recent rally may be stretched and susceptible to a pause. BBP and the Awesome Oscillator both signal strong buyer dominance, though overbought readings highlight a divergence versus ongoing momentum.
Sideways consolidation likely as technicals cap breakout odds
Looking over the next five trading days, typical volatility may keep PEPE in a range between $0.00000395 and $0.00000438. The probability of a sustained breakout above the upper band is low (under 20%), as weekly technicals show bearish signals from RSI, MACD, and moving averages. The base expectation is for PEPE to consolidate sideways above immediate support at $0.00000395. A clear move below this level could open further downside, but a break and close above $0.00000438 would signal renewed bullish momentum.
Earlier, analysts noted that the introduction of a PEPE-based ETF represents a significant test of investor appetite for highly speculative crypto assets in regulated markets. With current technicals signaling strong but potentially overextended bullish momentum, traders should monitor whether PEPE can sustain support above $0.00000395 as a bellwether for continued resilience amid heightened volatility.








-
 Afghanistan
-
 Albania
-
 Algeria
-
 Angola
-
 Argentina
-
 Armenia
-
 Australia
-
 Austria
-
 Azerbaijan
-
 Bahamas
-
 Bahrain
-
 Bangladesh
-
 Belarus
-
 Belgium
-
 Bolivia
-
 Botswana
-
 Brazil
-
 Brunei
-
 Bulgaria
-
 Cambodia
-
 Cameroon
-
 Canada
-
 Chile
Chile
-
 China
China
-
 Colombia
-
 Congo
Congo
-
 Costa Rica
-
 Cote d'Ivoire
-
 Croatia
-
 Cuba
Cuba
-
 Cyprus
-
 Czechia
-
 DR Congo
-
 Denmark
-
 Dominican Republic
-
 Ecuador
-
 Egypt
Egypt
-
 El Salvador
-
 Estonia
-
 Eswatini
-
 Ethiopia
-
 Finland
-
 France
-
 Georgia
-
 Germany
-
 Ghana
Ghana
-
 Greece
-
 Haiti
Haiti
-
 Hong Kong
-
 Hungary
-
 India
India
-
 Indonesia
-
 Iran, Islamic republic
-
 Iraq
Iraq
-
 Ireland
-
 Israel
-
 Italy
Italy
-
 Jamaica
-
 Japan
Japan
-
 Jordan
-
 Kazakhstan
-
 Kenya
Kenya
-
 Korea
Korea
-
 Kuwait
-
 Kyrgyzstan
-
 Laos
Laos
-
 Latvia
-
 Lebanon
-
 Lesotho
-
 Libya
Libya
-
 Lithuania
-
 Luxembourg
-
 Madagascar
-
 Malaysia
-
 Malta
Malta
-
 Mauritius
-
 Mexico
-
 Moldova
-
 Mongolia
-
 Montenegro
-
 Morocco
-
 Mozambique
-
 Myanmar
-
 Namibia
-
 Nepal
Nepal
-
 Netherlands
-
 New Zealand
-
 Nigeria
-
 North Macedonia
-
 Norway
-
 Oman
Oman
-
 Pakistan
-
 Palestine
-
 Panama
-
 Papua New Guinea
-
 Paraguay
-
 Peru
Peru
-
 Philippines
-
 Poland
-
 Portugal
-
 Puerto Rico
-
 Qatar
Qatar
-
 Reunion
-
 Romania
-
 Rwanda
-
 Saudi Arabia
-
 Serbia
-
 Singapore
-
 Slovakia
-
 Slovenia
-
 Somalia
-
 South Africa
-
 Spain
Spain
-
 Sri Lanka
-
 Sweden
-
 Switzerland
-
 Syria
Syria
-
 Taiwan
-
 Tajikistan
-
 Tanzania
-
 Thailand
-
 Trinidad and Tobago
-
 Tunisia
-
 Turkey
-
 UAE
UAE
-
 Uganda
-
 Ukraine
-
 United Kingdom
-
United States
-
 Uruguay
-
 Uzbekistan
-
 Venezuela
-
 Vietnam
-
 Yemen
Yemen
-
 Zambia
-
 Zimbabwe
- Forex
- Crypto











