
Solana price prediction: Can $86.00–$92.50 range hold after SOL jumps 4.39%?

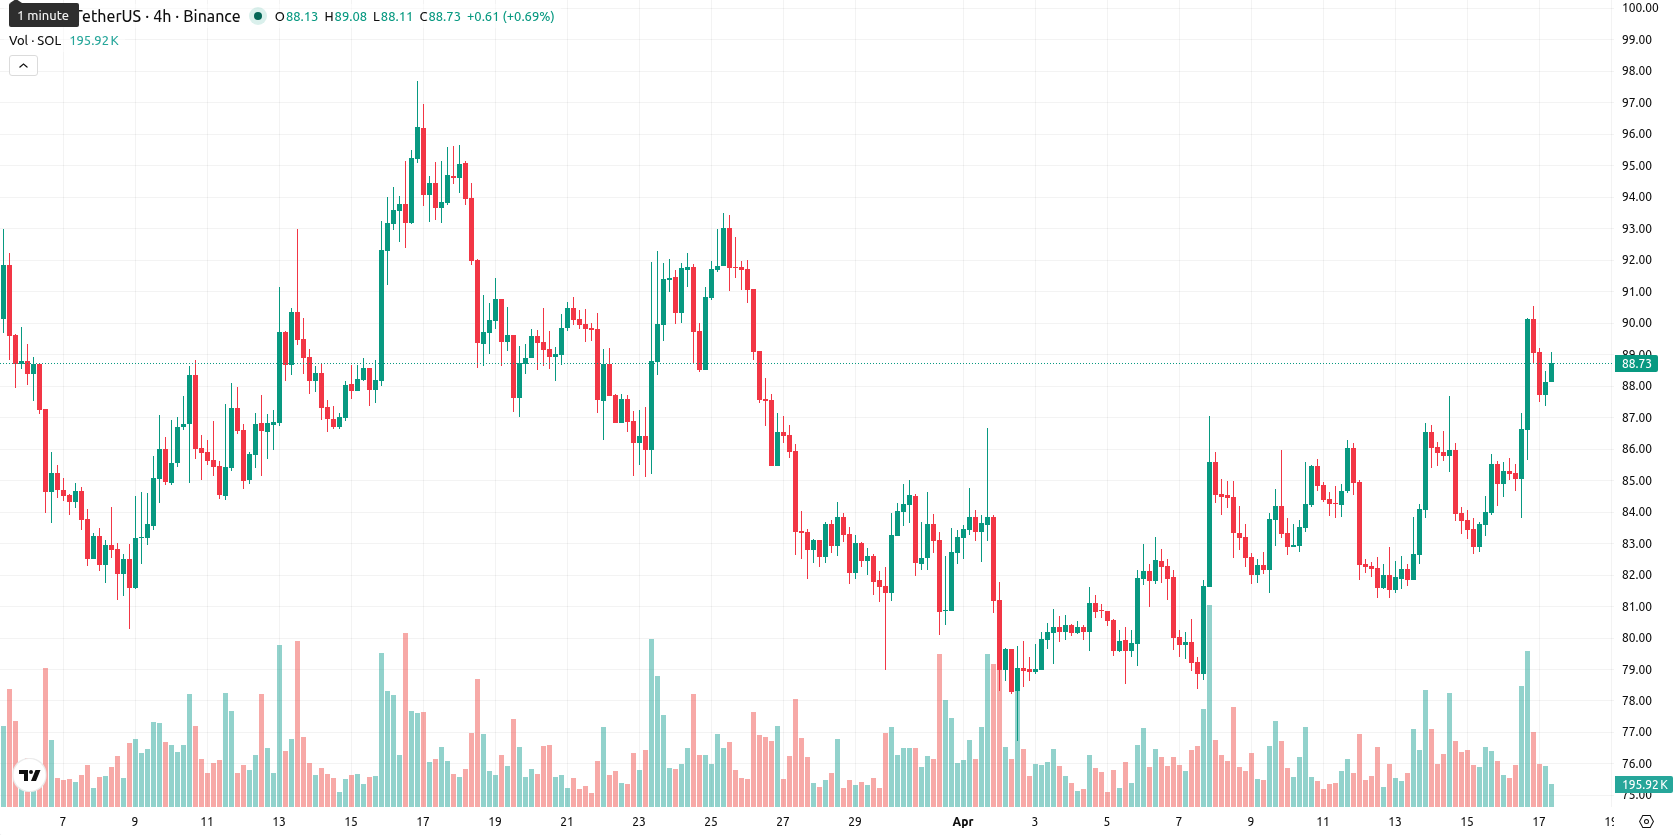
Solana (SOL) is trading at $88.85, up 4.39% on the day. The asset is positioned above both the SMA-20 ($82.97) and SMA-50 ($85.75), but remains well below the SMA-200 at $128.24, signalling a short- and medium-term bullish structure but ongoing long-term bearish pressure.
Highlights
- Circle minted $500 million USDC on Solana, raising this year's total to $38 billion and strengthening Solana's stablecoin market share.
- A teaser combining $XRP and $SOL logos signaled possible Ripple-Solana collaboration, boosting derivative demand and speculation.
- SOL maintains short-term bullish momentum within $86.00–$92.50, though overbought signals and weak long-term trend suggest likely sideways to modest downside.
Stablecoin inflows and Ripple speculation boost Solana derivative demand
On April 16, 2026, Circle minted $500 million USDC on Solana, bringing the total USDC issued on the network this year to $38 billion and boosting Solana’s position in stablecoin issuance. Solana also published a cryptic video featuring the $XRP and $SOL logos, hinting at a potential collaboration with Ripple and driving greater demand for related derivatives. Additionally, DoubleZero launched DoubleZero Edge, a platform providing real-time Solana blockchain data to trading firms and opening a new revenue stream for validators.
Overbought signals diverge from neutral momentum as buy pressure persists
SOL is trading above the SMA-20 ($82.97) and SMA-50 ($85.75), but well below the SMA-200 ($128.24), indicating short- and medium-term bullish structure but persistent long-term bearish pressure. The Ichimoku Kijun on D1 sits at $85.09, making it immediate support. Momentum indicators on D1 are mixed: MACD and ADX are neutral, while the RSI (56.83) suggests ongoing buying interest. However, Stoch RSI, BBP, and CCI all signal overbought conditions, reflecting notable short-term buyer dominance. BBP at 5.77 confirms bullish intraday momentum, though AO does not support a sustained move. The price opened with an upside gap and remains near the session’s high, up 4.39% at $88.85 on moderate intraday volatility. There is a visible divergence between overbought oscillators and neutral momentum, which may caution against chasing strength; intraday tone skews toward persistent buy pressure after the open.
Sideways trading expected as longer-term bearish momentum curbs upside
Over the next 5 trading days, the typical volatility band is seen at $86.00 – $92.50. There is a very low probability (less than 20%) of a sustained upside move, making further decrease more likely, as indicated by bearish signals on the weekly MA, RSI, ADX, and MACD. The base case is sideways consolidation in the $86.00 – $92.50 band. A break above $92.50 may prompt renewed buying interest toward short-term highs, while a drop below $86.00 could expose more downside as weak longer-term momentum weighs on the trend.
Earlier, analysts noted that Solana was exhibiting technical weakness and downside risks despite isolated signs of strength. The latest developments—including surging USDC issuance, hints at potential Ripple collaboration, and mixed momentum signals—introduce new catalysts but maintain a cautious outlook, with traders now watching the $92.50 level as a potential trigger for upside continuation or renewed volatility.


Latest Solana News


-
 Afghanistan
-
 Albania
-
 Algeria
-
 Angola
-
 Argentina
-
 Armenia
-
 Australia
-
 Austria
-
 Azerbaijan
-
 Bahamas
-
 Bahrain
-
 Bangladesh
-
 Belarus
-
 Belgium
-
 Bolivia
-
 Botswana
-
 Brazil
-
 Brunei
-
 Bulgaria
-
 Cambodia
-
 Cameroon
-
 Canada
-
 Chile
Chile
-
 China
China
-
 Colombia
-
 Congo
Congo
-
 Costa Rica
-
 Cote d'Ivoire
-
 Croatia
-
 Cuba
Cuba
-
 Cyprus
-
 Czechia
-
 DR Congo
-
 Denmark
-
 Dominican Republic
-
 Ecuador
-
 Egypt
Egypt
-
 El Salvador
-
 Estonia
-
 Eswatini
-
 Ethiopia
-
 Finland
-
 France
-
 Georgia
-
 Germany
-
 Ghana
Ghana
-
 Greece
-
 Haiti
Haiti
-
 Hong Kong
-
 Hungary
-
 India
India
-
 Indonesia
-
 Iran, Islamic republic
-
 Iraq
Iraq
-
 Ireland
-
 Israel
-
 Italy
Italy
-
 Jamaica
-
 Japan
Japan
-
 Jordan
-
 Kazakhstan
-
 Kenya
Kenya
-
 Korea
Korea
-
 Kuwait
-
 Kyrgyzstan
-
 Laos
Laos
-
 Latvia
-
 Lebanon
-
 Lesotho
-
 Libya
Libya
-
 Lithuania
-
 Luxembourg
-
 Madagascar
-
 Malaysia
-
 Malta
Malta
-
 Mauritius
-
 Mexico
-
 Moldova
-
 Mongolia
-
 Montenegro
-
 Morocco
-
 Mozambique
-
 Myanmar
-
 Namibia
-
 Nepal
Nepal
-
 Netherlands
-
 New Zealand
-
 Nigeria
-
 North Macedonia
-
 Norway
-
 Oman
Oman
-
 Pakistan
-
 Palestine
-
 Panama
-
 Papua New Guinea
-
 Paraguay
-
 Peru
Peru
-
 Philippines
-
 Poland
-
 Portugal
-
 Puerto Rico
-
 Qatar
Qatar
-
 Reunion
-
 Romania
-
 Rwanda
-
 Saudi Arabia
-
 Serbia
-
 Singapore
-
 Slovakia
-
 Slovenia
-
 Somalia
-
 South Africa
-
 Spain
Spain
-
 Sri Lanka
-
 Sweden
-
 Switzerland
-
 Syria
Syria
-
 Taiwan
-
 Tajikistan
-
 Tanzania
-
 Thailand
-
 Trinidad and Tobago
-
 Tunisia
-
 Turkey
-
 UAE
UAE
-
 Uganda
-
 Ukraine
-
 United Kingdom
-
United States
-
 Uruguay
-
 Uzbekistan
-
 Venezuela
-
 Vietnam
-
 Yemen
Yemen
-
 Zambia
-
 Zimbabwe
- Forex
- Crypto
