
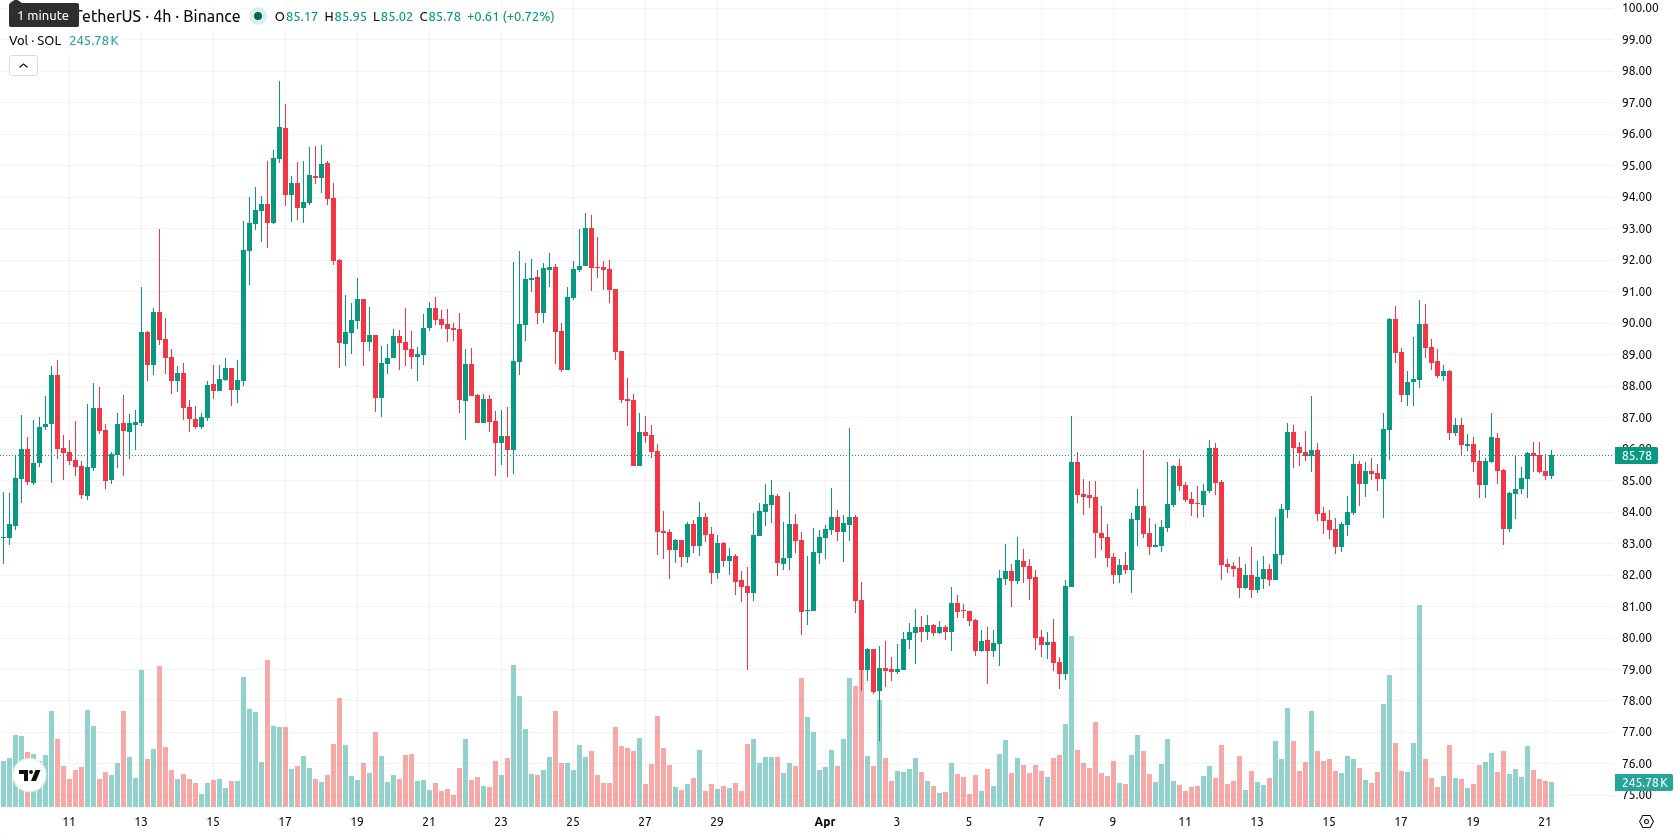
Solana price prediction: $81.00–$88.00 range in focus as SOL advances 1.53%

Solana (SOL) is trading at $85.40 after a 1.53% gain in the most recent session, with prices sitting above its key short-term moving averages but below medium-term benchmarks.
Highlights
- Drift Protocol, Solana's largest perpetuals platform, suffered a $285 million hack linked to North Korea, triggering major asset outflows.
- Despite the security incident and liquidity drain, Solana led all blockchains in decentralized application revenue for the fifth consecutive week.
- SOL trades with mixed momentum signals, consolidating between $81.00 and $88.00, with a higher risk of further declines than upside moves.
Protocol hack and liquidity exodus drive elevated borrowing costs
On April 20, 2026, Solana’s largest perpetual futures platform, Drift Protocol, was hacked with $285 million in value transferred, reportedly linked to North Korea and totaling over half the protocol’s assets. The event triggered a wave of capital outflows from the ecosystem, with USDC liquidity drained from Kamino Finance and borrowing rates surging as utilization spiked across Solana lending markets. Despite these incidents, Solana has surpassed Ethereum for the fifth consecutive week in weekly decentralized application revenue, maintaining its leading position in on-chain trading activity.
Intraday buying strength amid mixed momentum and technical barriers
SOL is currently positioned above its SMA-20 at $83.69 but just below the SMA-50 level at $85.91, while the SMA-200 at $125.56 remains a distant resistance point. The immediate technical support is the Ichimoku Kijun at $84.34. Momentum indicators show mixed signals: the MACD and ADX on the daily chart are neutral, the RSI sits near 50, and neither the Stoch RSI nor CCI indicates extremes. However, Bull/Bear Power (BBP) is elevated at 1.05, indicating buyers dominate intraday, and the Awesome Oscillator is positive, while overall volatility remains moderate. This combination of an overbought BBP with otherwise balanced oscillators suggests intraday strength but highlights caution due to conflicting momentum signals.
Limited breakout risk as SOL consolidates between key support levels
Over the next five trading days, SOL is expected to remain in a typical volatility band between $81.00 and $88.00, reflecting consolidation amid mixed momentum signals and technical support near the Kijun. The likelihood of an upward breakout is low, with probabilities of a price increase estimated below 20%, and sideways movement as the baseline scenario. A break above $88.00 could prompt stop-driven buying, while a move below $81.00 would signal renewed downside momentum and bring further support levels into focus.
Earlier, analysts noted that Solana was mired in sideways trading amid uncertain momentum and persistent security concerns. The recent exploit involving Drift Protocol highlights ongoing vulnerabilities and reinforces the need for traders to monitor $88.00 as a potential breakout level that could alter the prevailing period of consolidation.


Latest Solana News


-
 Afghanistan
-
 Albania
-
 Algeria
-
 Angola
-
 Argentina
-
 Armenia
-
 Australia
-
 Austria
-
 Azerbaijan
-
 Bahamas
-
 Bahrain
-
 Bangladesh
-
 Belarus
-
 Belgium
-
 Bolivia
-
 Botswana
-
 Brazil
-
 Brunei
-
 Bulgaria
-
 Cambodia
-
 Cameroon
-
 Canada
-
 Chile
Chile
-
 China
China
-
 Colombia
-
 Congo
Congo
-
 Costa Rica
-
 Cote d'Ivoire
-
 Croatia
-
 Cuba
Cuba
-
 Cyprus
-
 Czechia
-
 DR Congo
-
 Denmark
-
 Dominican Republic
-
 Ecuador
-
 Egypt
Egypt
-
 El Salvador
-
 Estonia
-
 Eswatini
-
 Ethiopia
-
 Finland
-
 France
-
 Georgia
-
 Germany
-
 Ghana
Ghana
-
 Greece
-
 Haiti
Haiti
-
 Hong Kong
-
 Hungary
-
 India
India
-
 Indonesia
-
 Iran, Islamic republic
-
 Iraq
Iraq
-
 Ireland
-
 Israel
-
 Italy
Italy
-
 Jamaica
-
 Japan
Japan
-
 Jordan
-
 Kazakhstan
-
 Kenya
Kenya
-
 Korea
Korea
-
 Kuwait
-
 Kyrgyzstan
-
 Laos
Laos
-
 Latvia
-
 Lebanon
-
 Lesotho
-
 Libya
Libya
-
 Lithuania
-
 Luxembourg
-
 Madagascar
-
 Malaysia
-
 Malta
Malta
-
 Mauritius
-
 Mexico
-
 Moldova
-
 Mongolia
-
 Montenegro
-
 Morocco
-
 Mozambique
-
 Myanmar
-
 Namibia
-
 Nepal
Nepal
-
 Netherlands
-
 New Zealand
-
 Nigeria
-
 North Macedonia
-
 Norway
-
 Oman
Oman
-
 Pakistan
-
 Palestine
-
 Panama
-
 Papua New Guinea
-
 Paraguay
-
 Peru
Peru
-
 Philippines
-
 Poland
-
 Portugal
-
 Puerto Rico
-
 Qatar
Qatar
-
 Reunion
-
 Romania
-
 Rwanda
-
 Saudi Arabia
-
 Serbia
-
 Singapore
-
 Slovakia
-
 Slovenia
-
 Somalia
-
 South Africa
-
 Spain
Spain
-
 Sri Lanka
-
 Sweden
-
 Switzerland
-
 Syria
Syria
-
 Taiwan
-
 Tajikistan
-
 Tanzania
-
 Thailand
-
 Trinidad and Tobago
-
 Tunisia
-
 Turkey
-
 UAE
UAE
-
 Uganda
-
 Ukraine
-
 United Kingdom
-
United States
-
 Uruguay
-
 Uzbekistan
-
 Venezuela
-
 Vietnam
-
 Yemen
Yemen
-
 Zambia
-
 Zimbabwe
- Forex
- Crypto
