
Bitcoin price prediction: Will $73,500–$82,000 range cap gains? BTC rises 2.91%

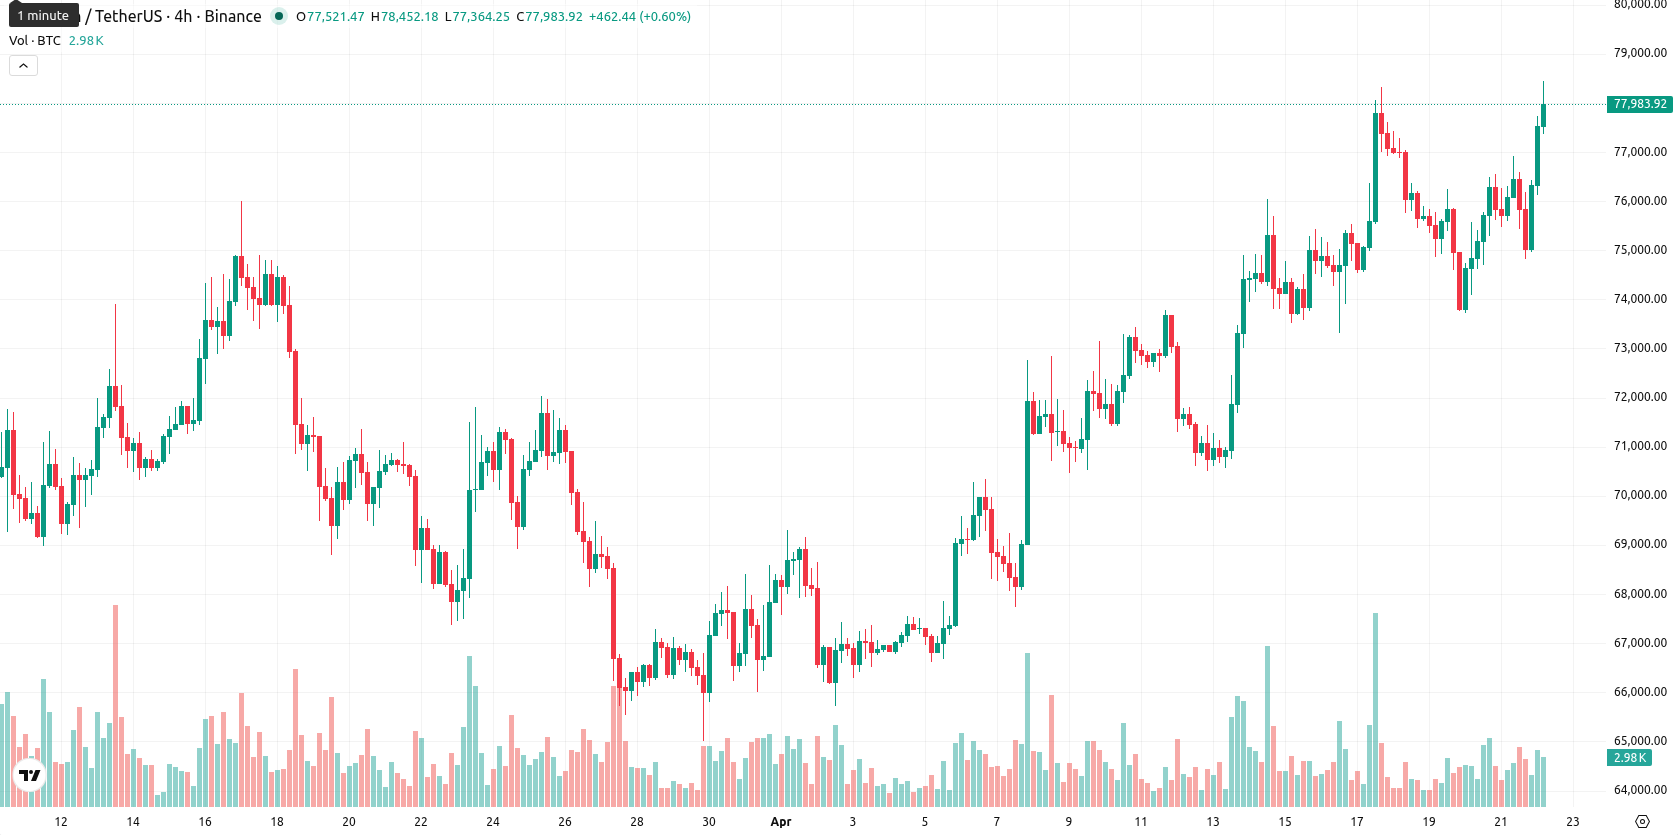
Bitcoin (BTC) is trading at $78,006.19, up 2.91% on the day, and sits firmly above its key moving averages. The asset’s price is showing continued momentum relative to its recent trend.
Highlights
- Strategy acquired 34,164 BTC for $2.54 billion, surpassing BlackRock’s ETF as the largest institutional Bitcoin holder.
- U.S. spot Bitcoin ETFs experienced five consecutive days of inflows totaling $238 million, reflecting continued institutional accumulation.
- Bitcoin trades with strong short- and medium-term bullish momentum, but overbought signals and weak trend strength suggest consolidation between $73,500 and $82,000.
Institutional accumulation rises as MicroStrategy eclipses BlackRock holdings
Strategy, formerly MicroStrategy, has overtaken BlackRock’s iShares Bitcoin Trust as the world’s largest institutional holder of Bitcoin following its acquisition of 34,164 BTC for $2.54 billion on April 21, 2026. This purchase, funded mainly through a $2.18 billion sale of perpetual preferred stock under the STRC program, brings its total holdings to 815,061 BTC, nearly four percent of the total supply. U.S. spot Bitcoin ETFs recorded five consecutive days of inflows, adding $238 million, supported by ongoing institutional demand and continued accumulation by large on-chain holders.
Bullish momentum persists amid overbought signals and volatility risk
BTC currently trades above the MA-20 at $72,365.66 and the MA-50 at $70,709.95, with the MA-200 offering overhead resistance at $86,123.10. The Ichimoku Kijun sits at $71,666.50, acting as immediate support. Daily timeframe momentum signals remain positive: the MACD shows a buy signal, ADX is neutral at 14.68, and the Awesome Oscillator aligns with the upward trend. Oscillators present a mixed picture; while RSI at 60.22 and CCI at 89.79 confirm bullish but not extreme conditions, both Stoch RSI and BBP are overbought, flagging the risk of a short-term pullback. BTC is near the upper end of today’s trading range ($76,140.09–$78,390.82), with moderate-to-high volatility and no significant overnight price gap.
Consolidation expected as technicals reduce odds of sustained rally
In the next five trading days, BTC is expected to trade within a typical volatility band of $73,500 to $82,000. Weekly indicator readings, including the MA-50, MACD, ADX, and RSI, point to a less than 20% probability of a sustained price advance, favoring consolidation or a potential decline unless short-term momentum persists. The base case is for sideways action above the Ichimoku Kijun and short-term moving averages. A break above $78,400–$79,000 could open a move toward the upper end of the range, while overbought conditions or a breach of immediate support may trigger a drop toward $73,500 or lower.
Earlier, analysts noted that Bitcoin had demonstrated resilience and maintained a bullish bias despite recent geopolitical uncertainties. The latest developments—highlighted by robust institutional accumulation and continued spot ETF inflows—signal that ongoing momentum could test upper resistance, with $78,400–$79,000 emerging as a critical zone to monitor for a potential breakout or pullback.


Latest Bitcoin News


-
 Afghanistan
-
 Albania
-
 Algeria
-
 Angola
-
 Argentina
-
 Armenia
-
 Australia
-
 Austria
-
 Azerbaijan
-
 Bahamas
-
 Bahrain
-
 Bangladesh
-
 Belarus
-
 Belgium
-
 Bolivia
-
 Botswana
-
 Brazil
-
 Brunei
-
 Bulgaria
-
 Cambodia
-
 Cameroon
-
 Canada
-
 Chile
Chile
-
 China
China
-
 Colombia
-
 Congo
Congo
-
 Costa Rica
-
 Cote d'Ivoire
-
 Croatia
-
 Cuba
Cuba
-
 Cyprus
-
 Czechia
-
 DR Congo
-
 Denmark
-
 Dominican Republic
-
 Ecuador
-
 Egypt
Egypt
-
 El Salvador
-
 Estonia
-
 Eswatini
-
 Ethiopia
-
 Finland
-
 France
-
 Georgia
-
 Germany
-
 Ghana
Ghana
-
 Greece
-
 Haiti
Haiti
-
 Hong Kong
-
 Hungary
-
 India
India
-
 Indonesia
-
 Iran, Islamic republic
-
 Iraq
Iraq
-
 Ireland
-
 Israel
-
 Italy
Italy
-
 Jamaica
-
 Japan
Japan
-
 Jordan
-
 Kazakhstan
-
 Kenya
Kenya
-
 Korea
Korea
-
 Kuwait
-
 Kyrgyzstan
-
 Laos
Laos
-
 Latvia
-
 Lebanon
-
 Lesotho
-
 Libya
Libya
-
 Lithuania
-
 Luxembourg
-
 Madagascar
-
 Malaysia
-
 Malta
Malta
-
 Mauritius
-
 Mexico
-
 Moldova
-
 Mongolia
-
 Montenegro
-
 Morocco
-
 Mozambique
-
 Myanmar
-
 Namibia
-
 Nepal
Nepal
-
 Netherlands
-
 New Zealand
-
 Nigeria
-
 North Macedonia
-
 Norway
-
 Oman
Oman
-
 Pakistan
-
 Palestine
-
 Panama
-
 Papua New Guinea
-
 Paraguay
-
 Peru
Peru
-
 Philippines
-
 Poland
-
 Portugal
-
 Puerto Rico
-
 Qatar
Qatar
-
 Reunion
-
 Romania
-
 Rwanda
-
 Saudi Arabia
-
 Serbia
-
 Singapore
-
 Slovakia
-
 Slovenia
-
 Somalia
-
 South Africa
-
 Spain
Spain
-
 Sri Lanka
-
 Sweden
-
 Switzerland
-
 Syria
Syria
-
 Taiwan
-
 Tajikistan
-
 Tanzania
-
 Thailand
-
 Trinidad and Tobago
-
 Tunisia
-
 Turkey
-
 UAE
UAE
-
 Uganda
-
 Ukraine
-
 United Kingdom
-
United States
-
 Uruguay
-
 Uzbekistan
-
 Venezuela
-
 Vietnam
-
 Yemen
Yemen
-
 Zambia
-
 Zimbabwe
- Forex
- Crypto
