
Solana price prediction: Will $84.00–$92.00 range hold as SOL gains 2.82%?

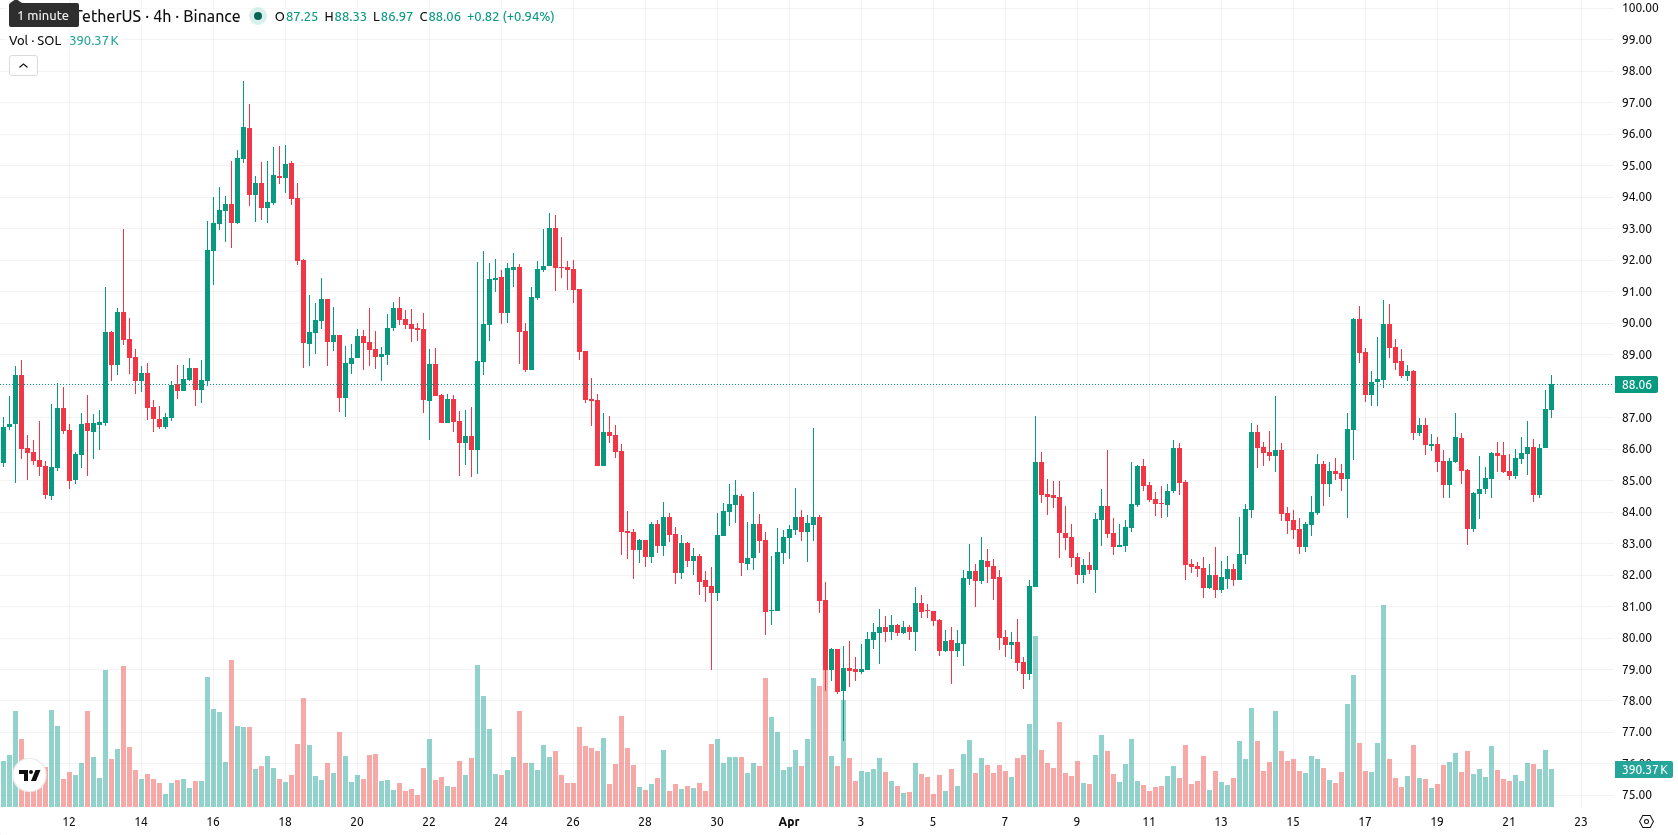
Solana (SOL) is trading at $88.02, up 2.82% for the day. The price currently sits above its key short- and medium-term moving averages but remains below longer-term averages.
Highlights
- Solana led decentralized application revenue for five straight weeks in Q1, capturing $284.5 billion in spot DEX volume and a 41% market share.
- Arkham launched direct token trading on Solana and SoFi Bank enabled 13.7 million users to track and deposit Solana, boosting institutional and retail exposure.
- SOL trades in a short-term bullish range with strong intraday buying, but technicals indicate overbought conditions and a likely consolidation between $84.00 and $92.00.
Sustained inflows and user growth as token demand surges
On April 21, 2026, Arkham introduced a trading feature for direct token discovery and execution of Solana-based tokens, utilizing live trader data and analytics on the Solana network. Solana reported leading decentralized application revenue generation for five straight weeks, capturing $284.5 billion in spot DEX trading volume in Q1 and 41% of the total market share. The asset has seen spot ETF inflows for five consecutive days and $292 million in total decentralized application revenue during Q1, driven by platforms such as Pumpfun, Axiom, Phantom, and Jupiter. Additionally, SoFi Bank enabled its 13.7 million users to deposit and track Solana holdings alongside Bitcoin and Ethereum.
Mixed momentum as overbought signals limit bullish follow-through
On the technical front, SOL trades above the SMA-20 at $83.91 and SMA-50 at $85.89, but remains well below the SMA-200 at $124.83. The Ichimoku Kijun level at $83.72 serves as immediate support. Momentum readings are mixed: the MACD is bullish and shows positive momentum, while ADX remains neutral, suggesting limited trend strength. RSI at 50.82 and CCI at 56.04 point to mild bullishness, but Stoch RSI and Bull/Bear Power (BBP) confirm overbought conditions, and the Awesome Oscillator is neutral. Price action is concentrated near today's high of $88.18, with rising volatility and signals of short-term exhaustion.
Range-bound trading likely as upside momentum meets weak trend
In the short term, a typical volatility band for SOL is likely to hold between $84.00 and $92.00 over the next five days, with the upside capped by long-term weak technicals. The probability of a decisive price increase remains low, as most weekly indicators continue to point bearish. The baseline scenario expects sideways consolidation between $84.00 support and $92.00 resistance. A move above $92.00 could trigger brief momentum buying, while a break below $84.00 may open the way for renewed selling pressure aligned with the broader downtrend.
Earlier, analysts noted that Solana was consolidating amid mixed technical signals and heightened regulatory and security pressures following significant DeFi exploits. The latest developments, including sustained DApp growth, spot ETF inflows, and broader institutional access, now introduce new drivers to watch, with traders advised to monitor for a potential directional shift should price break and hold above the $92.00 resistance.


Latest Solana News


-
 Afghanistan
-
 Albania
-
 Algeria
-
 Angola
-
 Argentina
-
 Armenia
-
 Australia
-
 Austria
-
 Azerbaijan
-
 Bahamas
-
 Bahrain
-
 Bangladesh
-
 Belarus
-
 Belgium
-
 Bolivia
-
 Botswana
-
 Brazil
-
 Brunei
-
 Bulgaria
-
 Cambodia
-
 Cameroon
-
 Canada
-
 Chile
Chile
-
 China
China
-
 Colombia
-
 Congo
Congo
-
 Costa Rica
-
 Cote d'Ivoire
-
 Croatia
-
 Cuba
Cuba
-
 Cyprus
-
 Czechia
-
 DR Congo
-
 Denmark
-
 Dominican Republic
-
 Ecuador
-
 Egypt
Egypt
-
 El Salvador
-
 Estonia
-
 Eswatini
-
 Ethiopia
-
 Finland
-
 France
-
 Georgia
-
 Germany
-
 Ghana
Ghana
-
 Greece
-
 Haiti
Haiti
-
 Hong Kong
-
 Hungary
-
 India
India
-
 Indonesia
-
 Iran, Islamic republic
-
 Iraq
Iraq
-
 Ireland
-
 Israel
-
 Italy
Italy
-
 Jamaica
-
 Japan
Japan
-
 Jordan
-
 Kazakhstan
-
 Kenya
Kenya
-
 Korea
Korea
-
 Kuwait
-
 Kyrgyzstan
-
 Laos
Laos
-
 Latvia
-
 Lebanon
-
 Lesotho
-
 Libya
Libya
-
 Lithuania
-
 Luxembourg
-
 Madagascar
-
 Malaysia
-
 Malta
Malta
-
 Mauritius
-
 Mexico
-
 Moldova
-
 Mongolia
-
 Montenegro
-
 Morocco
-
 Mozambique
-
 Myanmar
-
 Namibia
-
 Nepal
Nepal
-
 Netherlands
-
 New Zealand
-
 Nigeria
-
 North Macedonia
-
 Norway
-
 Oman
Oman
-
 Pakistan
-
 Palestine
-
 Panama
-
 Papua New Guinea
-
 Paraguay
-
 Peru
Peru
-
 Philippines
-
 Poland
-
 Portugal
-
 Puerto Rico
-
 Qatar
Qatar
-
 Reunion
-
 Romania
-
 Rwanda
-
 Saudi Arabia
-
 Serbia
-
 Singapore
-
 Slovakia
-
 Slovenia
-
 Somalia
-
 South Africa
-
 Spain
Spain
-
 Sri Lanka
-
 Sweden
-
 Switzerland
-
 Syria
Syria
-
 Taiwan
-
 Tajikistan
-
 Tanzania
-
 Thailand
-
 Trinidad and Tobago
-
 Tunisia
-
 Turkey
-
 UAE
UAE
-
 Uganda
-
 Ukraine
-
 United Kingdom
-
United States
-
 Uruguay
-
 Uzbekistan
-
 Venezuela
-
 Vietnam
-
 Yemen
Yemen
-
 Zambia
-
 Zimbabwe
- Forex
- Crypto
