
APT edges lower with MACD signaling strong sell momentum: weekly forecast

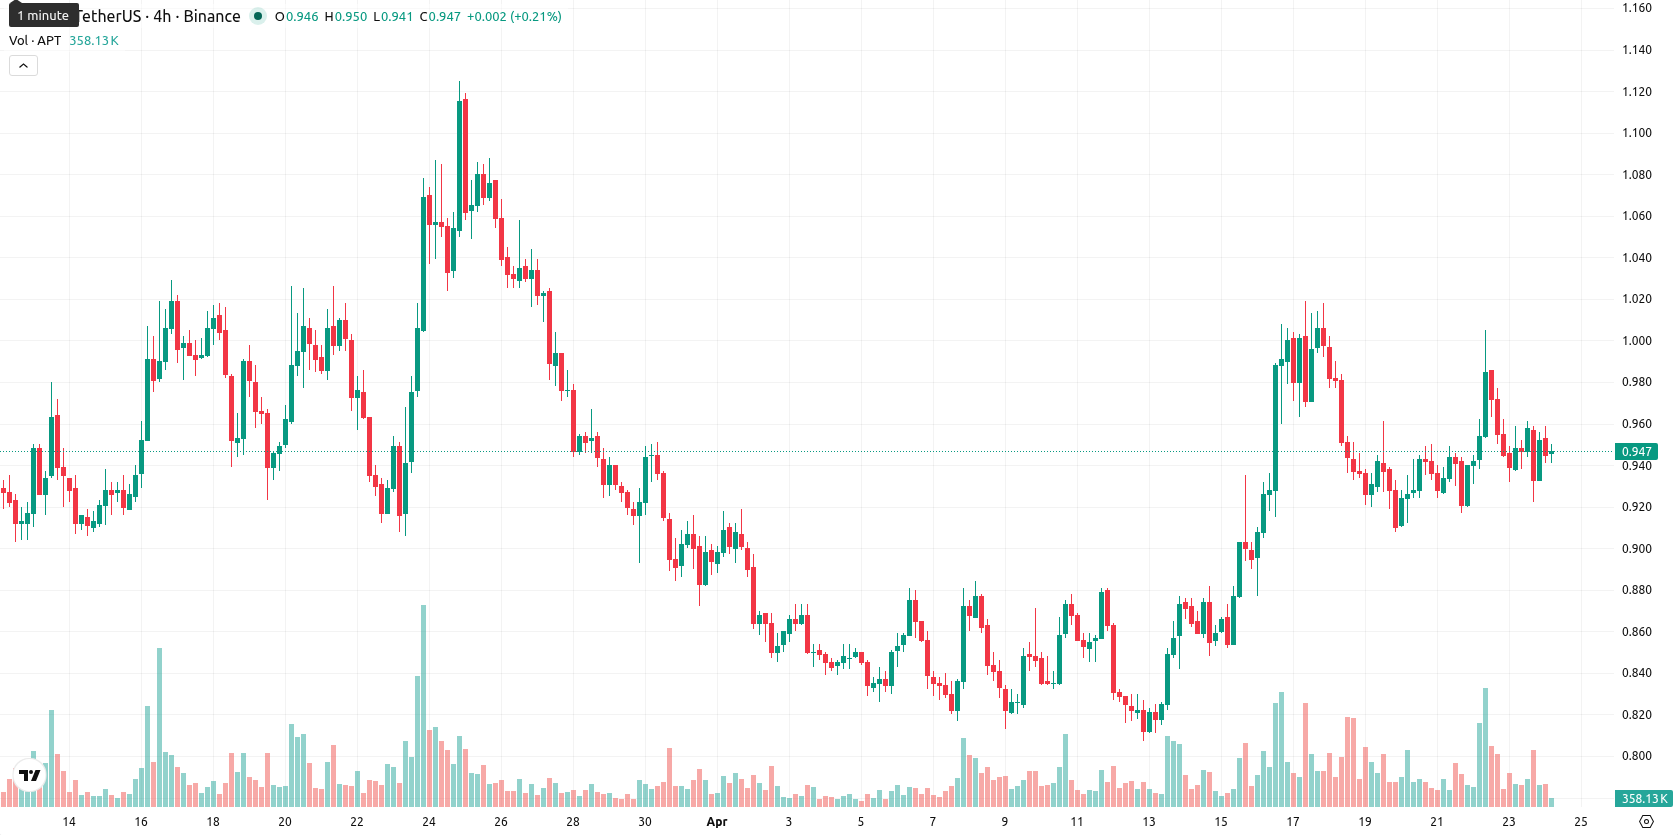
Aptos (APT) is currently trading at $0.948, having declined $0.0200 or 2.17% over the past week. The asset remains well below its key W1 moving averages — MA-20 at $1.2042 and MA-50 at $2.9795 — indicating persistent bearish momentum and dominance by sellers.
Highlights
- APT currently trades below major moving averages, indicating persistent medium- and long-term bearish momentum.
- Momentum indicators remain strongly negative, with dominant selling pressure and little evidence of a trend reversal.
- Expected weekly range is $0.923 to $1.038, with high probability of further declines and limited upside potential.
Bearish momentum confirmed by technical signals over the week
Weekly technical analysis reflects a clear bearish configuration for APT. The price is trading beneath both the MA-20 and MA-50, with the MA-20 now serving as the nearest resistance on the weekly timeframe. Momentum indicators reinforce this weakness: the MACD signals a Strong Sell, the ADX confirms a prevailing bearish trend, and both the RSI and Commodity Channel Index remain aligned with further downside pressure. Stochastic RSI is elevated in the overbought region, hinting at short-term exhaustion, while negative Bull/Bear Power underscores ongoing seller control. Weekly volatility stands at 10.68%, with the asset hovering within its recent range.
Sideways consolidation likely as breakout risk remains subdued this week
For the next 7 days, APT is likely to consolidate between $0.923 and $1.038, according to its weekly technical outlook. The probability of a significant upward breakout is low, with less than a 20% chance of meaningfully exceeding the current range given that all major weekly momentum indicators remain bearish. The baseline scenario is continued sideways movement; however, a break below $0.923 could trigger renewed selling and the possibility of new lows before finding support. Conversely, a close above $1.038 would be needed to open up a more bullish scenario.
Earlier, analysts noted that Aptos continued to experience prevailing bearish momentum amid persistent selling pressure, with little evidence of a sustainable recovery. This outlook is reinforced by the latest technical analysis, which underscores ongoing downside risks and positions the MA-20 as a pivotal resistance to monitor for any potential shift in market direction over the coming week.


-
 Afghanistan
-
 Albania
-
 Algeria
-
 Angola
-
 Argentina
-
 Armenia
-
 Australia
-
 Austria
-
 Azerbaijan
-
 Bahamas
-
 Bahrain
-
 Bangladesh
-
 Belarus
-
 Belgium
-
 Bolivia
-
 Botswana
-
 Brazil
-
 Brunei
-
 Bulgaria
-
 Cambodia
-
 Cameroon
-
 Canada
-
 Chile
Chile
-
 China
China
-
 Colombia
-
 Congo
Congo
-
 Costa Rica
-
 Cote d'Ivoire
-
 Croatia
-
 Cuba
Cuba
-
 Cyprus
-
 Czechia
-
 DR Congo
-
 Denmark
-
 Dominican Republic
-
 Ecuador
-
 Egypt
Egypt
-
 El Salvador
-
 Estonia
-
 Eswatini
-
 Ethiopia
-
 Finland
-
 France
-
 Georgia
-
 Germany
-
 Ghana
Ghana
-
 Greece
-
 Haiti
Haiti
-
 Hong Kong
-
 Hungary
-
 India
India
-
 Indonesia
-
 Iran, Islamic republic
-
 Iraq
Iraq
-
 Ireland
-
 Israel
-
 Italy
Italy
-
 Jamaica
-
 Japan
Japan
-
 Jordan
-
 Kazakhstan
-
 Kenya
Kenya
-
 Korea
Korea
-
 Kuwait
-
 Kyrgyzstan
-
 Laos
Laos
-
 Latvia
-
 Lebanon
-
 Lesotho
-
 Libya
Libya
-
 Lithuania
-
 Luxembourg
-
 Madagascar
-
 Malaysia
-
 Malta
Malta
-
 Mauritius
-
 Mexico
-
 Moldova
-
 Mongolia
-
 Montenegro
-
 Morocco
-
 Mozambique
-
 Myanmar
-
 Namibia
-
 Nepal
Nepal
-
 Netherlands
-
 New Zealand
-
 Nigeria
-
 North Macedonia
-
 Norway
-
 Oman
Oman
-
 Pakistan
-
 Palestine
-
 Panama
-
 Papua New Guinea
-
 Paraguay
-
 Peru
Peru
-
 Philippines
-
 Poland
-
 Portugal
-
 Puerto Rico
-
 Qatar
Qatar
-
 Reunion
-
 Romania
-
 Rwanda
-
 Saudi Arabia
-
 Serbia
-
 Singapore
-
 Slovakia
-
 Slovenia
-
 Somalia
-
 South Africa
-
 Spain
Spain
-
 Sri Lanka
-
 Sweden
-
 Switzerland
-
 Syria
Syria
-
 Taiwan
-
 Tajikistan
-
 Tanzania
-
 Thailand
-
 Trinidad and Tobago
-
 Tunisia
-
 Turkey
-
 UAE
UAE
-
 Uganda
-
 Ukraine
-
 United Kingdom
-
United States
-
 Uruguay
-
 Uzbekistan
-
 Venezuela
-
 Vietnam
-
 Yemen
Yemen
-
 Zambia
-
 Zimbabwe
- Forex
- Crypto
