
Solana price prediction: Can $81.00 support hold? SOL trades flat

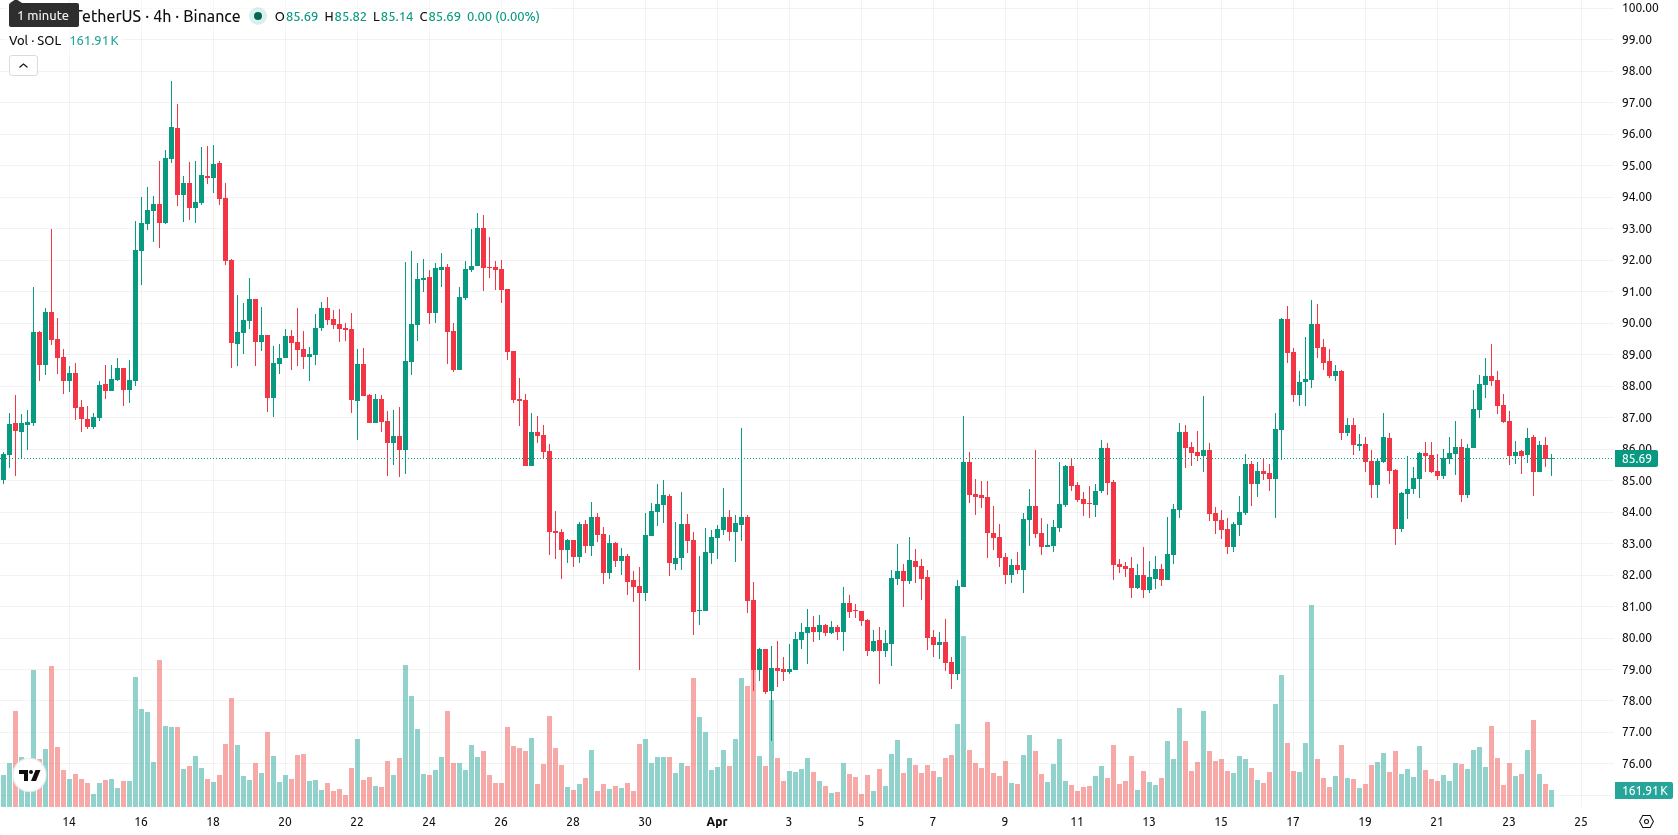
Solana (SOL) is trading at $85.64, marking a daily decline of 0.43%. The price currently sits slightly above its short-term moving averages, while remaining below longer-term trend levels.
Highlights
- Institutional inflows into spot SOL ETFs continued for a fifth day, pushing cumulative inflows above $1 billion as of April 20, 2026.
- Solana processed over $1 trillion in Q1 2026 on-chain volume, gained regulatory clarity as a digital commodity, and saw network developer participation rise to 23%.
- SOL trades with mild short-term bullish bias but faces strong long-term bearish pressure; expected range is $81.00 to $90.00, with downside favored.
Institutional inflows rise amid developer gains and regulatory clarity
Institutional inflows into spot SOL ETFs were reported for a fifth consecutive day, totaling $3.28 million on April 20, 2026, and cumulative inflows crossed $1 billion. Solana surpassed $2 billion in real-world asset tokenization on its network within twelve months, while over $1 trillion in on-chain economic volume was processed in the first quarter of 2026. The network also gained 4,100 new developers in Q1, raising its share to 23%, and integrated wrapped XRP through a collaboration with Hex Trust and LayerZero. In March 2026, US regulators classified SOL as a digital commodity, providing additional legal clarity, though price action has remained under broader selling pressure.
Mixed momentum as SOL straddles short-term support and neutral signals
SOL is currently positioned just above the SMA-20 at $84.61, narrowly below the SMA-50 at $85.80, and well beneath the SMA-200 at $123.41. The Ichimoku Kijun at $83.72 now acts as immediate support. On the momentum side, the MACD (D1) is a moderate buy, while the ADX is neutral and most oscillators, including RSI, Stoch RSI, and CCI, are near neutral readings; notably, the Stoch RSI signals a sell. BBP remains overbought on the daily chart, suggesting persistent buyer dominance intraday, yet the Awesome Oscillator is neutral and multiple momentum and oscillator divergences point to an uncertain and mixed intraday backdrop.
Bearish momentum persists as weekly indicators dampen rebound odds
For the coming week, the typical volatility band relative to current levels is expected between $81.00 and $90.00. Given strong bearish signals from weekly moving averages and momentum indicators, there is less than a 20% probability of an upward price move, favoring a further decline. If prices move sideways, consolidation in the $83.00 to $88.00 zone is likely. An upside scenario would require a break and hold above $90.00, while a bearish move below $81.00 could accelerate further declines and bring lower supports into view.
Earlier, analysts noted that downside risks were dominant for Solana, with bearish signals outweighing positive ecosystem developments amid regulatory and liquidity concerns. The recent wave of institutional ETF inflows and regulatory clarity on SOL's classification provides an important shift in market structure; however, the persistence of mixed momentum suggests traders should closely monitor for a confirmed breakout above $90.00 or a decisive drop below $81.00 to gauge the next trend direction.


-
 Afghanistan
-
 Albania
-
 Algeria
-
 Angola
-
 Argentina
-
 Armenia
-
 Australia
-
 Austria
-
 Azerbaijan
-
 Bahamas
-
 Bahrain
-
 Bangladesh
-
 Belarus
-
 Belgium
-
 Bolivia
-
 Botswana
-
 Brazil
-
 Brunei
-
 Bulgaria
-
 Cambodia
-
 Cameroon
-
 Canada
-
 Chile
Chile
-
 China
China
-
 Colombia
-
 Congo
Congo
-
 Costa Rica
-
 Cote d'Ivoire
-
 Croatia
-
 Cuba
Cuba
-
 Cyprus
-
 Czechia
-
 DR Congo
-
 Denmark
-
 Dominican Republic
-
 Ecuador
-
 Egypt
Egypt
-
 El Salvador
-
 Estonia
-
 Eswatini
-
 Ethiopia
-
 Finland
-
 France
-
 Georgia
-
 Germany
-
 Ghana
Ghana
-
 Greece
-
 Haiti
Haiti
-
 Hong Kong
-
 Hungary
-
 India
India
-
 Indonesia
-
 Iran, Islamic republic
-
 Iraq
Iraq
-
 Ireland
-
 Israel
-
 Italy
Italy
-
 Jamaica
-
 Japan
Japan
-
 Jordan
-
 Kazakhstan
-
 Kenya
Kenya
-
 Korea
Korea
-
 Kuwait
-
 Kyrgyzstan
-
 Laos
Laos
-
 Latvia
-
 Lebanon
-
 Lesotho
-
 Libya
Libya
-
 Lithuania
-
 Luxembourg
-
 Madagascar
-
 Malaysia
-
 Malta
Malta
-
 Mauritius
-
 Mexico
-
 Moldova
-
 Mongolia
-
 Montenegro
-
 Morocco
-
 Mozambique
-
 Myanmar
-
 Namibia
-
 Nepal
Nepal
-
 Netherlands
-
 New Zealand
-
 Nigeria
-
 North Macedonia
-
 Norway
-
 Oman
Oman
-
 Pakistan
-
 Palestine
-
 Panama
-
 Papua New Guinea
-
 Paraguay
-
 Peru
Peru
-
 Philippines
-
 Poland
-
 Portugal
-
 Puerto Rico
-
 Qatar
Qatar
-
 Reunion
-
 Romania
-
 Rwanda
-
 Saudi Arabia
-
 Serbia
-
 Singapore
-
 Slovakia
-
 Slovenia
-
 Somalia
-
 South Africa
-
 Spain
Spain
-
 Sri Lanka
-
 Sweden
-
 Switzerland
-
 Syria
Syria
-
 Taiwan
-
 Tajikistan
-
 Tanzania
-
 Thailand
-
 Trinidad and Tobago
-
 Tunisia
-
 Turkey
-
 UAE
UAE
-
 Uganda
-
 Ukraine
-
 United Kingdom
-
United States
-
 Uruguay
-
 Uzbekistan
-
 Venezuela
-
 Vietnam
-
 Yemen
Yemen
-
 Zambia
-
 Zimbabwe
- Forex
- Crypto
