
NEAR climbs 13.77% as price holds above MA-20 support: weekly outlook

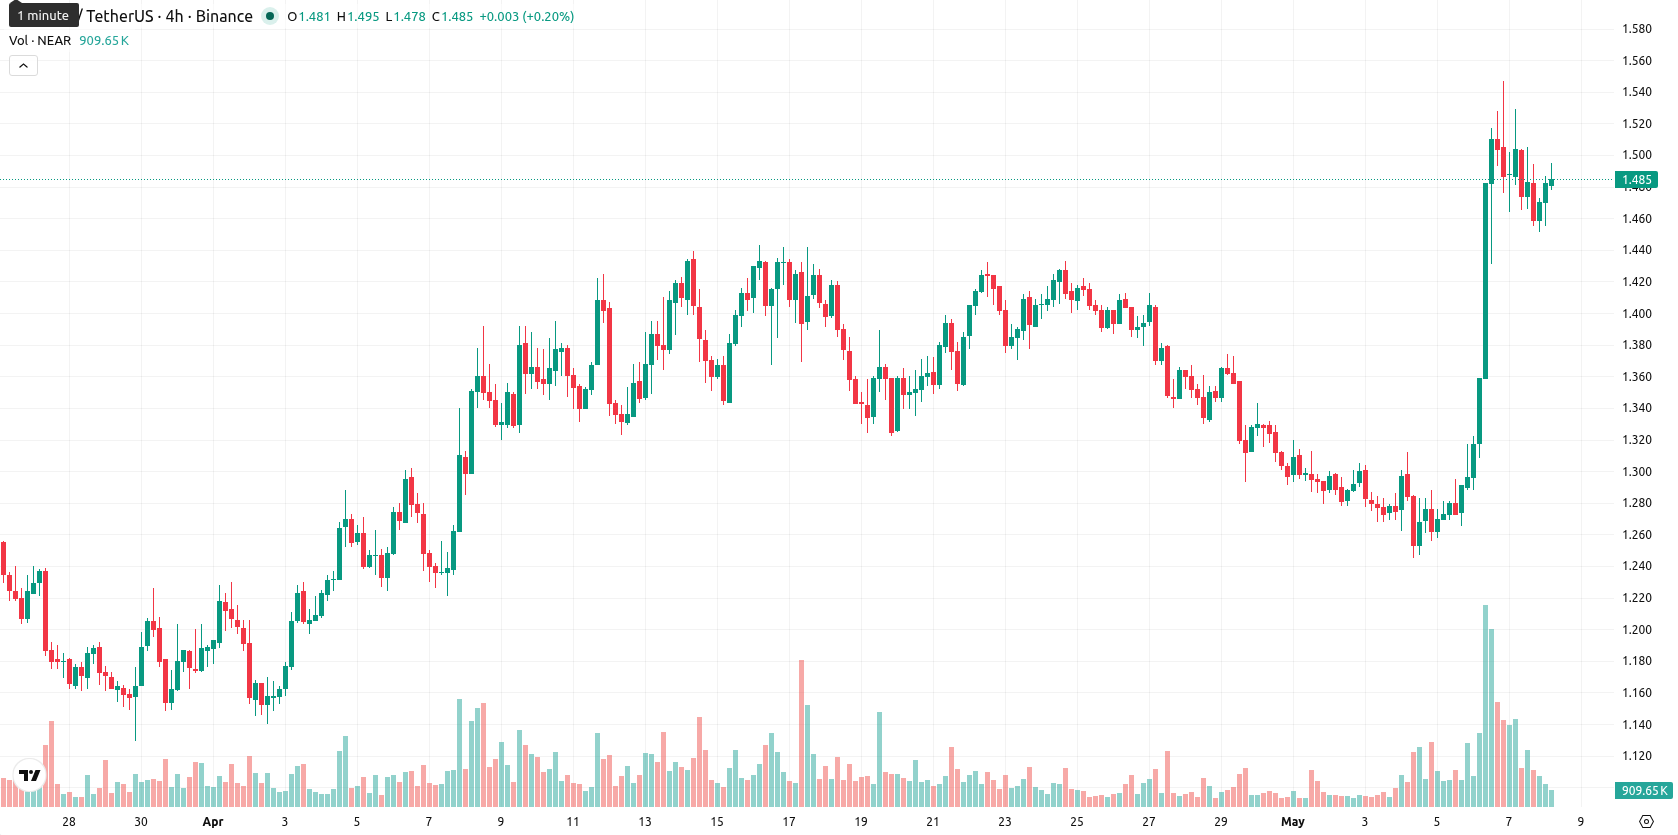
NEAR is currently trading at $1.484, having risen $0.1830 (13.77%) over the past week. The asset remains above its weekly MA-20 ($1.3283), but is still positioned below both the MA-50 ($1.9707) and MA-200 ($3.0721), reflecting a positive short-term move yet persistent medium- and long-term selling pressure.
Highlights
- NEAR's short-term momentum is positive but remains under medium- and long-term selling pressure, reflecting bearish overall trend structure.
- Volatility is elevated at 24.26% with recent price action confined to the upper weekly range amid mixed oscillator signals.
- For the upcoming week, NEAR will likely trade sideways between $1.35 and $1.63, with a decline more probable than a sustained breakout.
Mixed weekly signals as upside momentum fades below resistance
On the weekly chart, technical indicators send a mixed picture: NEAR continues to trade above the MA-20 but well below the MA-50 and MA-200, with the MA-50 now acting as dynamic resistance. MACD shows strong bearish momentum and the ADX remains weak and neutral, indicating the lack of a clear trend direction. The RSI is below 50 with a Sell reading, while the Stochastic RSI is extremely overbought and the Commodity Channel Index is neutral. Bull/Bear Power suggests some buyer strength persists, but overall technical signals point toward an uncertain outlook. Weekly volatility reached 24.26%, with NEAR trading in the upper part of the recent range; support is seen near $1.35, while resistance is at $1.63.
Sideways bias expected as bearish momentum tempers breakout risk
Looking ahead to the next 7 days, NEAR is expected to fluctuate between $1.35 and $1.63, with weekly indicators favoring a sideways or mildly bearish scenario. The probability of a clear upside breakout is low, as none of the four key W1 indicators are in Buy territory. If prices remain above support at $1.35, consolidation is likely; a drop below this level could trigger further downside risk. An unexpected bullish move above $1.63 would challenge dynamic resistance but seems unlikely given ongoing bearish momentum.
Earlier, analysts noted that NEAR maintained a bearish technical outlook with persistent downward momentum and weak buyer support. The latest mixed indicators suggest a tentative shift, but traders should monitor $1.35 as a critical support level, as a break below it could accelerate renewed downside pressure.


Latest NEAR News


-
 Afghanistan
-
 Albania
-
 Algeria
-
 Angola
-
 Argentina
-
 Armenia
-
 Australia
-
 Austria
-
 Azerbaijan
-
 Bahamas
-
 Bahrain
-
 Bangladesh
-
 Belarus
-
 Belgium
-
 Bolivia
-
 Botswana
-
 Brazil
-
 Brunei
-
 Bulgaria
-
 Cambodia
-
 Cameroon
-
 Canada
-
 Chile
Chile
-
 China
China
-
 Colombia
-
 Congo
Congo
-
 Costa Rica
-
 Cote d'Ivoire
-
 Croatia
-
 Cuba
Cuba
-
 Cyprus
-
 Czechia
-
 DR Congo
-
 Denmark
-
 Dominican Republic
-
 Ecuador
-
 Egypt
Egypt
-
 El Salvador
-
 Estonia
-
 Eswatini
-
 Ethiopia
-
 Finland
-
 France
-
 Georgia
-
 Germany
-
 Ghana
Ghana
-
 Greece
-
 Haiti
Haiti
-
 Hong Kong
-
 Hungary
-
 India
India
-
 Indonesia
-
 Iran, Islamic republic
-
 Iraq
Iraq
-
 Ireland
-
 Israel
-
 Italy
Italy
-
 Jamaica
-
 Japan
Japan
-
 Jordan
-
 Kazakhstan
-
 Kenya
Kenya
-
 Korea
Korea
-
 Kuwait
-
 Kyrgyzstan
-
 Laos
Laos
-
 Latvia
-
 Lebanon
-
 Lesotho
-
 Libya
Libya
-
 Lithuania
-
 Luxembourg
-
 Madagascar
-
 Malaysia
-
 Malta
Malta
-
 Mauritius
-
 Mexico
-
 Moldova
-
 Mongolia
-
 Montenegro
-
 Morocco
-
 Mozambique
-
 Myanmar
-
 Namibia
-
 Nepal
Nepal
-
 Netherlands
-
 New Zealand
-
 Nigeria
-
 North Macedonia
-
 Norway
-
 Oman
Oman
-
 Pakistan
-
 Palestine
-
 Panama
-
 Papua New Guinea
-
 Paraguay
-
 Peru
Peru
-
 Philippines
-
 Poland
-
 Portugal
-
 Puerto Rico
-
 Qatar
Qatar
-
 Reunion
-
 Romania
-
 Rwanda
-
 Saudi Arabia
-
 Serbia
-
 Singapore
-
 Slovakia
-
 Slovenia
-
 Somalia
-
 South Africa
-
 Spain
Spain
-
 Sri Lanka
-
 Sweden
-
 Switzerland
-
 Syria
Syria
-
 Taiwan
-
 Tajikistan
-
 Tanzania
-
 Thailand
-
 Trinidad and Tobago
-
 Tunisia
-
 Turkey
-
 UAE
UAE
-
 Uganda
-
 Ukraine
-
 United Kingdom
-
United States
-
 Uruguay
-
 Uzbekistan
-
 Venezuela
-
 Vietnam
-
 Yemen
Yemen
-
 Zambia
-
 Zimbabwe
- Forex
- Crypto
