
NEAR price prediction: Will $1.6340 support hold as NEAR sheds 7.08%?

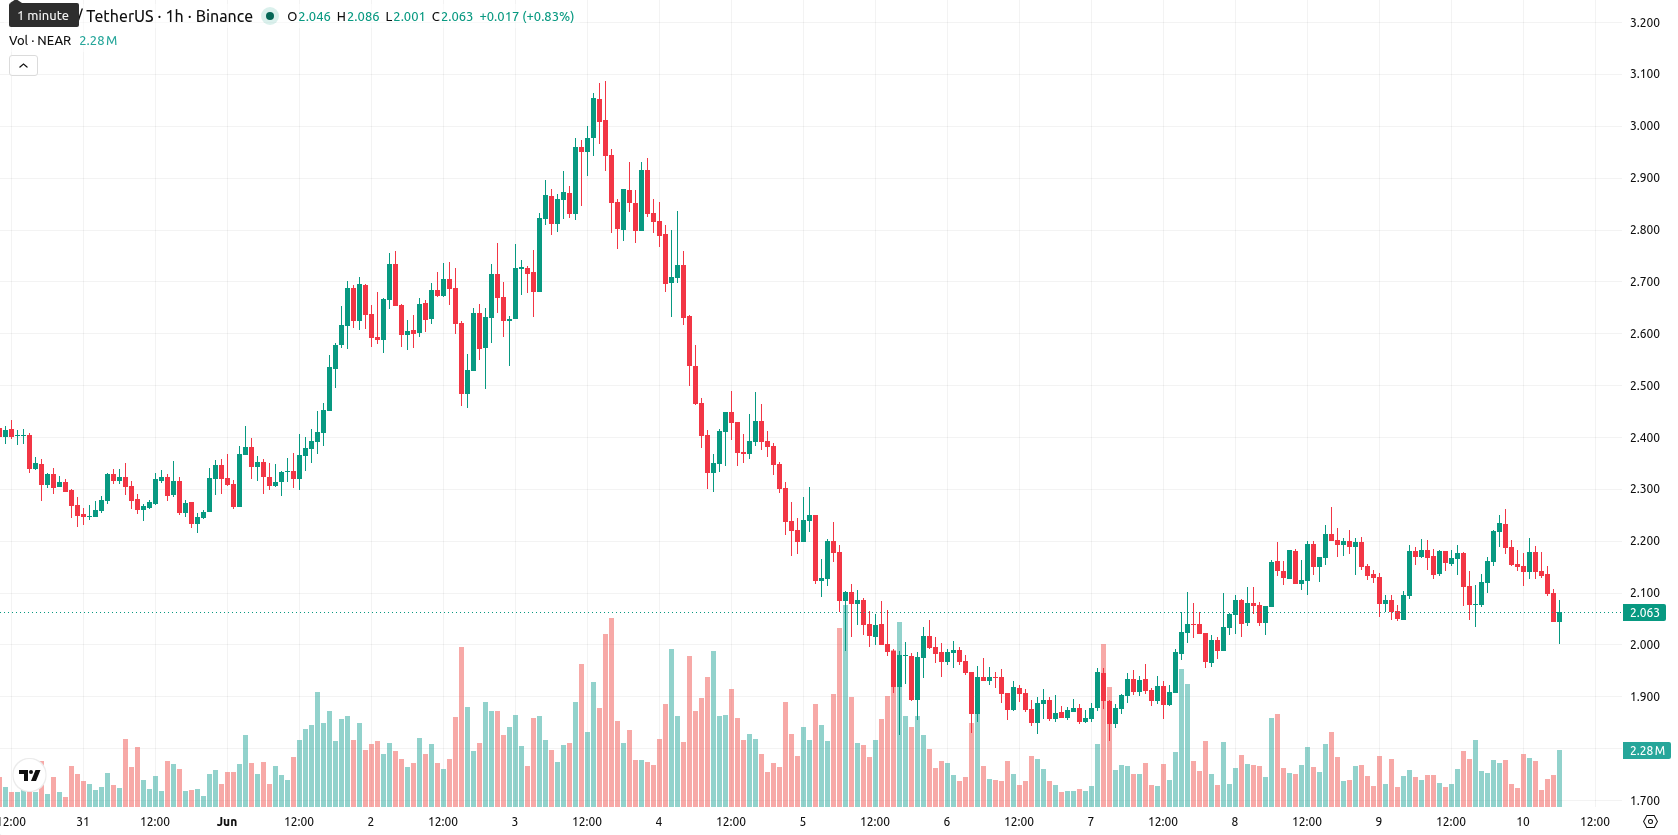
NEAR (NEAR) is trading at $2.0229, down 7.08% on the day. The asset currently sits below its main short- and medium-term moving averages but holds above the longer-term trend indicator.
Highlights
- NEAR is experiencing strong intraday bearish momentum, with price down 7.08% and testing daily lows at $2.0229.
- Technical indicators show overall bearish signals with oversold conditions, confirming persistent downside pressure and seller dominance.
- NEAR is likely to trade between $1.6340 and $2.2557 in coming sessions, with a 76% probability of further declines unless resistance at $2.1470 breaks.
Oversold momentum and resistance cap as sellers dominate NEAR
On the h1 timeframe, NEAR is positioned below the MA-20 ($2.1468) and MA-50 ($2.1450), but maintains support above the long-term MA-200 at $1.5141. Immediate resistance aligns with the Ichimoku Kijun at $2.1470. Key momentum oscillators present a mixed technical profile: RSI is at 39.263 (Sell), while MACD and ADX both show Neutral signals. Stoch RSI and CCI indicate oversold conditions, BBP highlights clear seller dominance intraday, and the Awesome Oscillator signals a strong sell bias, confirming intensive downside pressure.
Downside extension risk rises amid limited rebound odds
Over the next two to three sessions, NEAR is expected to fluctuate within the $1.6340 to $2.2557 volatility band relative to current levels. There is a 76% likelihood of a further downside extension, with only a 24% chance of an upward reversal. A sustained move above $2.1470 would be required for a bullish scenario, while a break below $1.6340 would expose additional downside risk.
Earlier, analysts noted that NEAR was experiencing conflicting momentum signals amid increased volatility, with a prevailing downside bias and limited prospects for near-term recovery. The latest technical data reinforces this negative outlook, with traders now advised to monitor the $1.6340 level as a key inflection point for additional downside risk.


-
 Afghanistan
-
 Albania
-
 Algeria
-
 Angola
-
 Argentina
-
 Armenia
-
 Australia
-
 Austria
-
 Azerbaijan
-
 Bahamas
-
 Bahrain
-
 Bangladesh
-
 Belarus
-
 Belgium
-
 Bolivia
-
 Botswana
-
 Brazil
-
 Brunei
-
 Bulgaria
-
 Cambodia
-
 Cameroon
-
 Canada
-
 Chile
Chile
-
 China
China
-
 Colombia
-
 Congo
Congo
-
 Costa Rica
-
 Cote d'Ivoire
-
 Croatia
-
 Cuba
Cuba
-
 Cyprus
-
 Czechia
-
 DR Congo
-
 Denmark
-
 Dominican Republic
-
 Ecuador
-
 Egypt
Egypt
-
 El Salvador
-
 Estonia
-
 Eswatini
-
 Ethiopia
-
 Finland
-
 France
-
 Georgia
-
 Germany
-
 Ghana
Ghana
-
 Greece
-
 Haiti
Haiti
-
 Hong Kong
-
 Hungary
-
 India
India
-
 Indonesia
-
 Iran, Islamic republic
-
 Iraq
Iraq
-
 Ireland
-
 Israel
-
 Italy
Italy
-
 Jamaica
-
 Japan
Japan
-
 Jordan
-
 Kazakhstan
-
 Kenya
Kenya
-
 Korea
Korea
-
 Kuwait
-
 Kyrgyzstan
-
 Laos
Laos
-
 Latvia
-
 Lebanon
-
 Lesotho
-
 Libya
Libya
-
 Lithuania
-
 Luxembourg
-
 Madagascar
-
 Malaysia
-
 Malta
Malta
-
 Mauritius
-
 Mexico
-
 Moldova
-
 Mongolia
-
 Montenegro
-
 Morocco
-
 Mozambique
-
 Myanmar
-
 Namibia
-
 Nepal
Nepal
-
 Netherlands
-
 New Zealand
-
 Nigeria
-
 North Macedonia
-
 Norway
-
 Oman
Oman
-
 Pakistan
-
 Palestine
-
 Panama
-
 Papua New Guinea
-
 Paraguay
-
 Peru
Peru
-
 Philippines
-
 Poland
-
 Portugal
-
 Puerto Rico
-
 Qatar
Qatar
-
 Reunion
-
 Romania
-
 Rwanda
-
 Saudi Arabia
-
 Serbia
-
 Singapore
-
 Slovakia
-
 Slovenia
-
 Somalia
-
 South Africa
-
 Spain
Spain
-
 Sri Lanka
-
 Sweden
-
 Switzerland
-
 Syria
Syria
-
 Taiwan
-
 Tajikistan
-
 Tanzania
-
 Thailand
-
 Trinidad and Tobago
-
 Tunisia
-
 Turkey
-
 UAE
UAE
-
 Uganda
-
 Ukraine
-
 United Kingdom
-
United States
-
 Uruguay
-
 Uzbekistan
-
 Venezuela
-
 Vietnam
-
 Yemen
Yemen
-
 Zambia
-
 Zimbabwe
- Forex
- Crypto
