
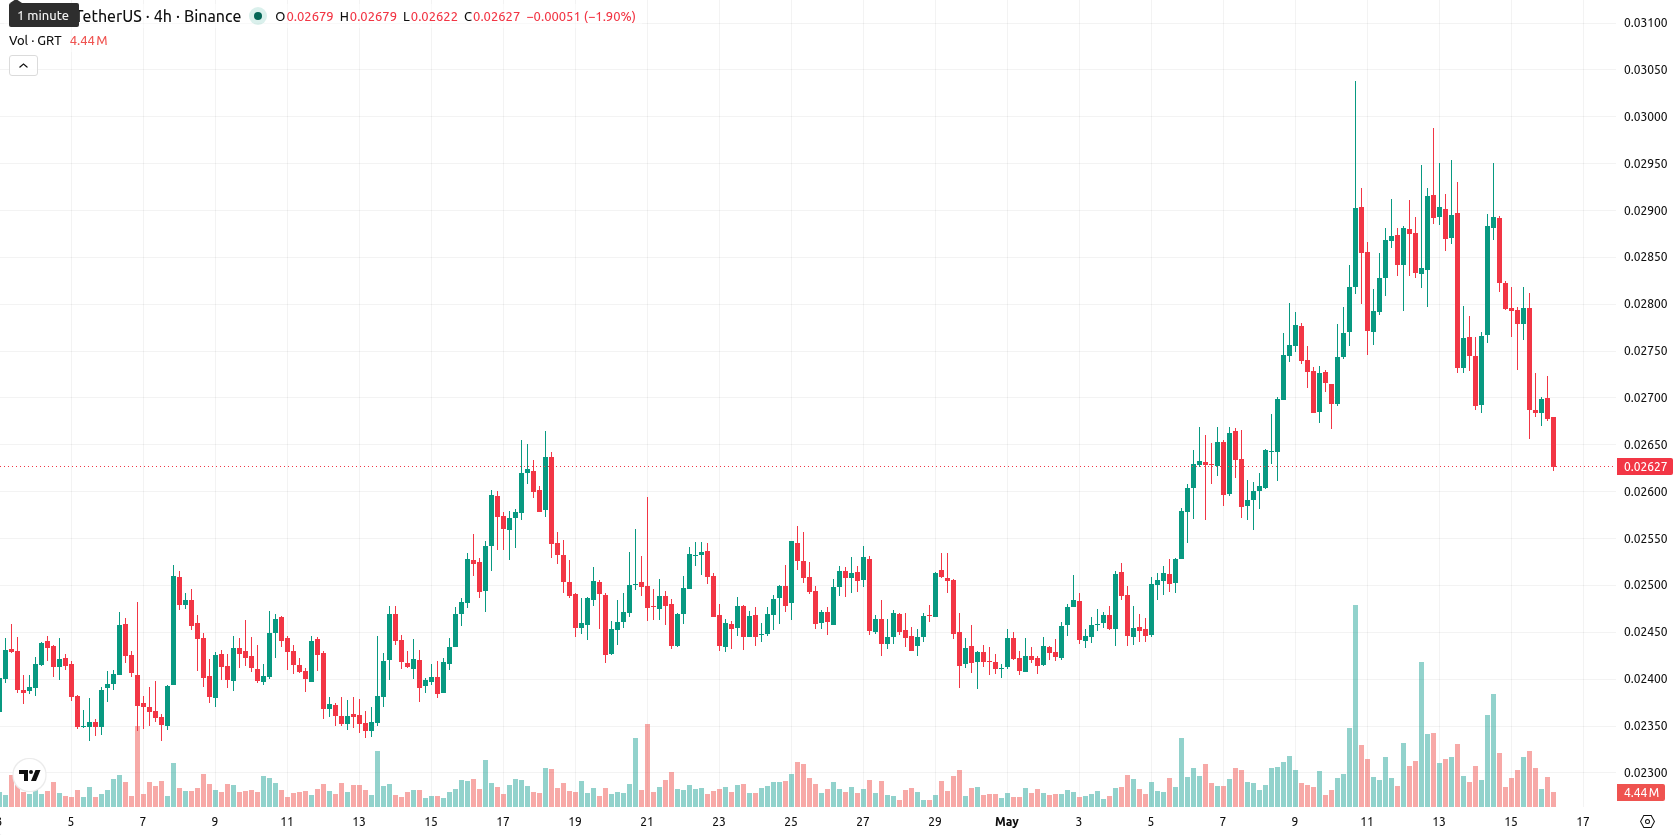
GRT under pressure amid persistent weakness relative to major moving averages: weekly analysis

The Graph (GRT) is currently trading at $0.026434, marking a weekly decline of $0.0011 or 4.19%. The asset remains under pressure, sitting below its weekly MA-20 ($0.02858135), MA-50 ($0.05752474), and MA-200 ($0.12978069), with the nearest resistance at the MA-20 level.
Highlights
- GRT remains under sustained bearish pressure, trading below key moving averages with seller momentum dominating the medium- and long-term trends.
- Momentum indicators, including MACD and ADX, confirm an ongoing negative bias, while oscillators show no strong oversold signal and only mildly positive buyer activity.
- Projected range for GRT is $0.0254 to $0.0279 over the next week, with downside risk heightened if price breaks below current support.
Persistent bearish signals over the week as momentum indicators weaken
Weekly technicals for GRT continue to signal bearish momentum: the MACD flashes a 'Strong Sell', ADX posts 'Sell', and RSI indicates 'Sell' as well, with CCI holding neutral. The Stochastic RSI, however, is overbought, suggesting a possible near-term pullback, but the Awesome Oscillator remains neutral and Bull/Bear Power is only slightly positive. Price action remains anchored near key support, with volatility at 14.38%, and the trend shows persistent weakness relative to all major weekly moving averages.
Rangebound outlook for next week amid persistent downside risks
Over the next 7 days, GRT is likely to remain rangebound, with projected trading between $0.0254 and $0.0279, following the observed weekly trend and volatility. A low probability (less than 20%) exists for an upside breakout, as weekly indicators collectively point to continued downward momentum. If the price manages a bullish reversal above $0.0279, gains will likely face resistance at the MA-20; otherwise, a break below $0.0254 opens a path toward further declines on ongoing selling pressure.
Earlier, analysts noted that The Graph remained in a broader bearish trend despite intermittent periods of short-term bullish momentum. The latest weekly technicals reinforce this view, underscoring persistent downside risk and making defense of the $0.0254 support level crucial for traders monitoring potential further declines.


-
 Afghanistan
-
 Albania
-
 Algeria
-
 Angola
-
 Argentina
-
 Armenia
-
 Australia
-
 Austria
-
 Azerbaijan
-
 Bahamas
-
 Bahrain
-
 Bangladesh
-
 Belarus
-
 Belgium
-
 Bolivia
-
 Botswana
-
 Brazil
-
 Brunei
-
 Bulgaria
-
 Cambodia
-
 Cameroon
-
 Canada
-
 Chile
Chile
-
 China
China
-
 Colombia
-
 Congo
Congo
-
 Costa Rica
-
 Cote d'Ivoire
-
 Croatia
-
 Cuba
Cuba
-
 Cyprus
-
 Czechia
-
 DR Congo
-
 Denmark
-
 Dominican Republic
-
 Ecuador
-
 Egypt
Egypt
-
 El Salvador
-
 Estonia
-
 Eswatini
-
 Ethiopia
-
 Finland
-
 France
-
 Georgia
-
 Germany
-
 Ghana
Ghana
-
 Greece
-
 Haiti
Haiti
-
 Hong Kong
-
 Hungary
-
 India
India
-
 Indonesia
-
 Iran, Islamic republic
-
 Iraq
Iraq
-
 Ireland
-
 Israel
-
 Italy
Italy
-
 Jamaica
-
 Japan
Japan
-
 Jordan
-
 Kazakhstan
-
 Kenya
Kenya
-
 Korea
Korea
-
 Kuwait
-
 Kyrgyzstan
-
 Laos
Laos
-
 Latvia
-
 Lebanon
-
 Lesotho
-
 Libya
Libya
-
 Lithuania
-
 Luxembourg
-
 Madagascar
-
 Malaysia
-
 Malta
Malta
-
 Mauritius
-
 Mexico
-
 Moldova
-
 Mongolia
-
 Montenegro
-
 Morocco
-
 Mozambique
-
 Myanmar
-
 Namibia
-
 Nepal
Nepal
-
 Netherlands
-
 New Zealand
-
 Nigeria
-
 North Macedonia
-
 Norway
-
 Oman
Oman
-
 Pakistan
-
 Palestine
-
 Panama
-
 Papua New Guinea
-
 Paraguay
-
 Peru
Peru
-
 Philippines
-
 Poland
-
 Portugal
-
 Puerto Rico
-
 Qatar
Qatar
-
 Reunion
-
 Romania
-
 Rwanda
-
 Saudi Arabia
-
 Serbia
-
 Singapore
-
 Slovakia
-
 Slovenia
-
 Somalia
-
 South Africa
-
 Spain
Spain
-
 Sri Lanka
-
 Sweden
-
 Switzerland
-
 Syria
Syria
-
 Taiwan
-
 Tajikistan
-
 Tanzania
-
 Thailand
-
 Trinidad and Tobago
-
 Tunisia
-
 Turkey
-
 UAE
UAE
-
 Uganda
-
 Ukraine
-
 United Kingdom
-
United States
-
 Uruguay
-
 Uzbekistan
-
 Venezuela
-
 Vietnam
-
 Yemen
Yemen
-
 Zambia
-
 Zimbabwe
- Forex
- Crypto
