
HBAR drifts lower as price remains under key moving averages: weekly outlook

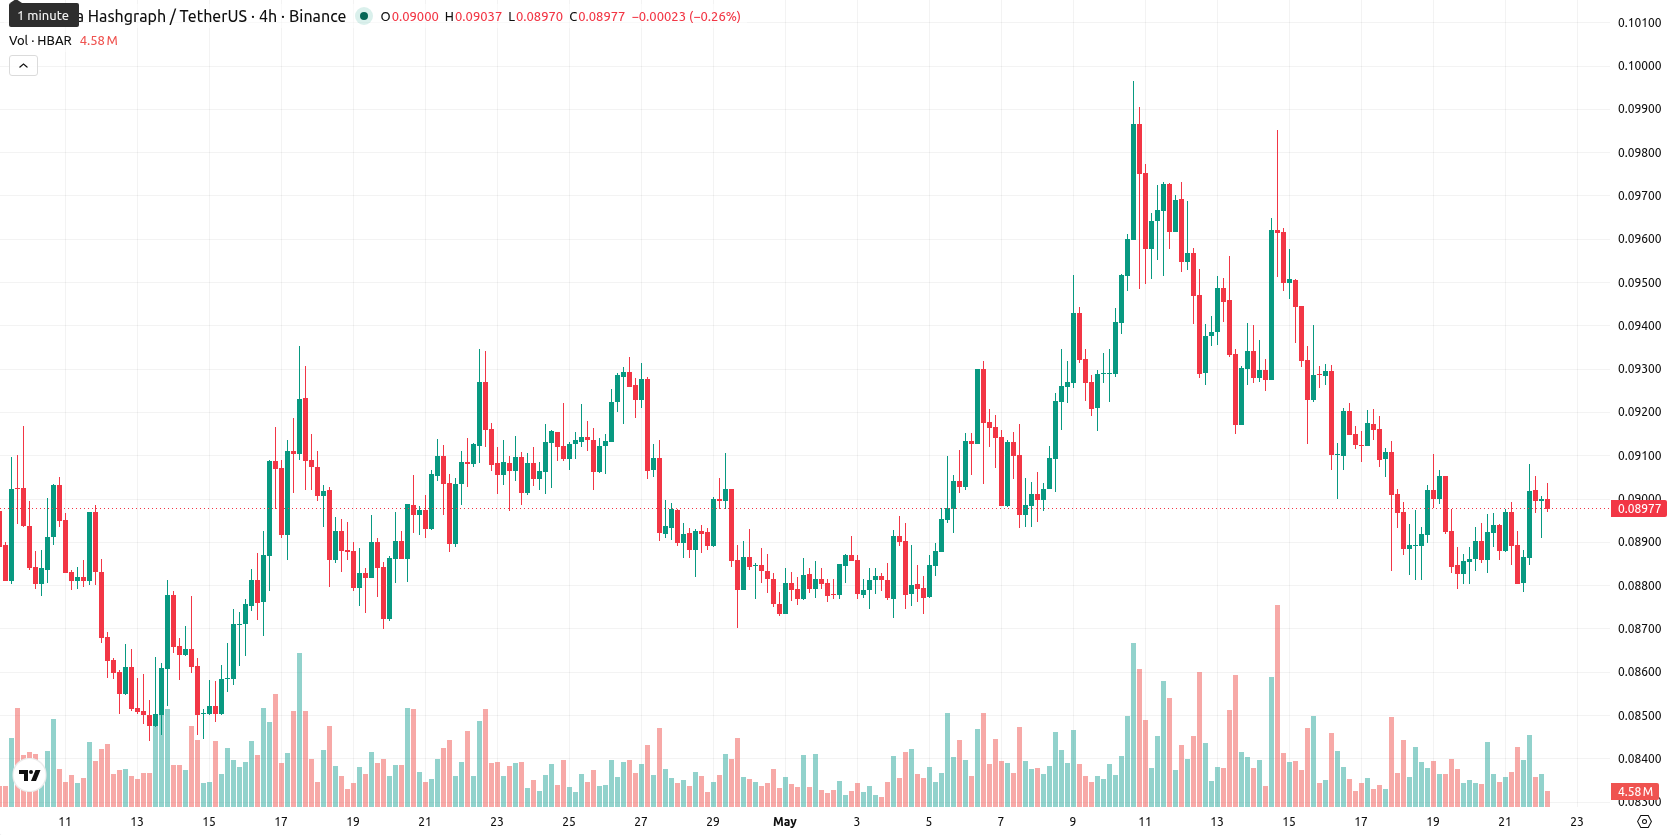
Hedera (HBAR) is currently trading at $0.0898, having fallen $0.0039 (3.93%) over the past week and now sitting below its weekly MA-20 ($0.0947), MA-50 ($0.1519), and MA-200 ($0.1105). The asset remains under steady downward pressure, residing in the lower part of its weekly range and below all key moving averages.
Highlights
- HBAR continues its downtrend, trading below key moving averages and sustaining persistent bearish momentum across all primary indicators.
- Recent weekly decline of 3.93% leaves price near the bottom of its range, with no technical indications of an imminent rebound.
- Next 7 days project consolidation between $0.0899 and $0.0927, but a breakdown below $0.0899 support is the most probable scenario.
Enterprise milestones and ETF inclusion drive institutional focus this week
Hedera has reached a new milestone in enterprise adoption, as more businesses are integrating its network to support real-world blockchain solutions. The Hashdex Nasdaq-listed crypto ETF recently expanded to include HBAR, granting institutional investors regulated access to the asset via traditional brokerage channels. Broader institutional and enterprise interest is strengthening Hedera’s profile as a leading blockchain platform.
Negative momentum persists as technical signals remain bearish during the week
On the weekly chart, HBAR remains firmly below the MA-20, MA-50, and MA-200, confirming persistent negative momentum in both its medium and long-term outlooks. Momentum indicators including MACD (Strong Sell), ADX (Sell), Bull/Bear Power (Sell), and oscillator readings with RSI (Sell), Stochastic RSI (Neutral), and CCI (Sell) reinforce the ongoing bearish sentiment, while volatility for the week held at 6.04%. Key support is noted near $0.0899 with initial resistance at $0.0927, and HBAR continues to drift steadily lower from its recent weekly high.
Sideways action expected next week as downside risks dominate
Over the next seven days, HBAR is expected to trade within a range of $0.0899 to $0.0927. All major weekly indicators currently signal continued downside, with less than a 20% probability for a meaningful upward move. In the baseline scenario, price action is likely to remain sideways near $0.091 with brief consolidation, though a pullback below the $0.0899 support is the more probable case if bearish momentum persists. For a move to the upside, HBAR would need to break above $0.0927 resistance, but recent momentum and technical signals do not support this outcome.
Earlier, analysts noted that Hedera continued to face sustained bearish momentum despite strengthening enterprise adoption and growing institutional interest. The latest developments reinforce the negative medium-term outlook, making price action near the $0.0899 support level especially critical for traders monitoring further downside risk.


-
 Afghanistan
-
 Albania
-
 Algeria
-
 Angola
-
 Argentina
-
 Armenia
-
 Australia
-
 Austria
-
 Azerbaijan
-
 Bahamas
-
 Bahrain
-
 Bangladesh
-
 Belarus
-
 Belgium
-
 Bolivia
-
 Botswana
-
 Brazil
-
 Brunei
-
 Bulgaria
-
 Cambodia
-
 Cameroon
-
 Canada
-
 Chile
Chile
-
 China
China
-
 Colombia
-
 Congo
Congo
-
 Costa Rica
-
 Cote d'Ivoire
-
 Croatia
-
 Cuba
Cuba
-
 Cyprus
-
 Czechia
-
 DR Congo
-
 Denmark
-
 Dominican Republic
-
 Ecuador
-
 Egypt
Egypt
-
 El Salvador
-
 Estonia
-
 Eswatini
-
 Ethiopia
-
 Finland
-
 France
-
 Georgia
-
 Germany
-
 Ghana
Ghana
-
 Greece
-
 Haiti
Haiti
-
 Hong Kong
-
 Hungary
-
 India
India
-
 Indonesia
-
 Iran, Islamic republic
-
 Iraq
Iraq
-
 Ireland
-
 Israel
-
 Italy
Italy
-
 Jamaica
-
 Japan
Japan
-
 Jordan
-
 Kazakhstan
-
 Kenya
Kenya
-
 Korea
Korea
-
 Kuwait
-
 Kyrgyzstan
-
 Laos
Laos
-
 Latvia
-
 Lebanon
-
 Lesotho
-
 Libya
Libya
-
 Lithuania
-
 Luxembourg
-
 Madagascar
-
 Malaysia
-
 Malta
Malta
-
 Mauritius
-
 Mexico
-
 Moldova
-
 Mongolia
-
 Montenegro
-
 Morocco
-
 Mozambique
-
 Myanmar
-
 Namibia
-
 Nepal
Nepal
-
 Netherlands
-
 New Zealand
-
 Nigeria
-
 North Macedonia
-
 Norway
-
 Oman
Oman
-
 Pakistan
-
 Palestine
-
 Panama
-
 Papua New Guinea
-
 Paraguay
-
 Peru
Peru
-
 Philippines
-
 Poland
-
 Portugal
-
 Puerto Rico
-
 Qatar
Qatar
-
 Reunion
-
 Romania
-
 Rwanda
-
 Saudi Arabia
-
 Serbia
-
 Singapore
-
 Slovakia
-
 Slovenia
-
 Somalia
-
 South Africa
-
 Spain
Spain
-
 Sri Lanka
-
 Sweden
-
 Switzerland
-
 Syria
Syria
-
 Taiwan
-
 Tajikistan
-
 Tanzania
-
 Thailand
-
 Trinidad and Tobago
-
 Tunisia
-
 Turkey
-
 UAE
UAE
-
 Uganda
-
 Ukraine
-
 United Kingdom
-
United States
-
 Uruguay
-
 Uzbekistan
-
 Venezuela
-
 Vietnam
-
 Yemen
Yemen
-
 Zambia
-
 Zimbabwe
- Forex
- Crypto
