
The Graph consolidates near $0.027 facing persistent MACD strong sell signals: weekly forecast

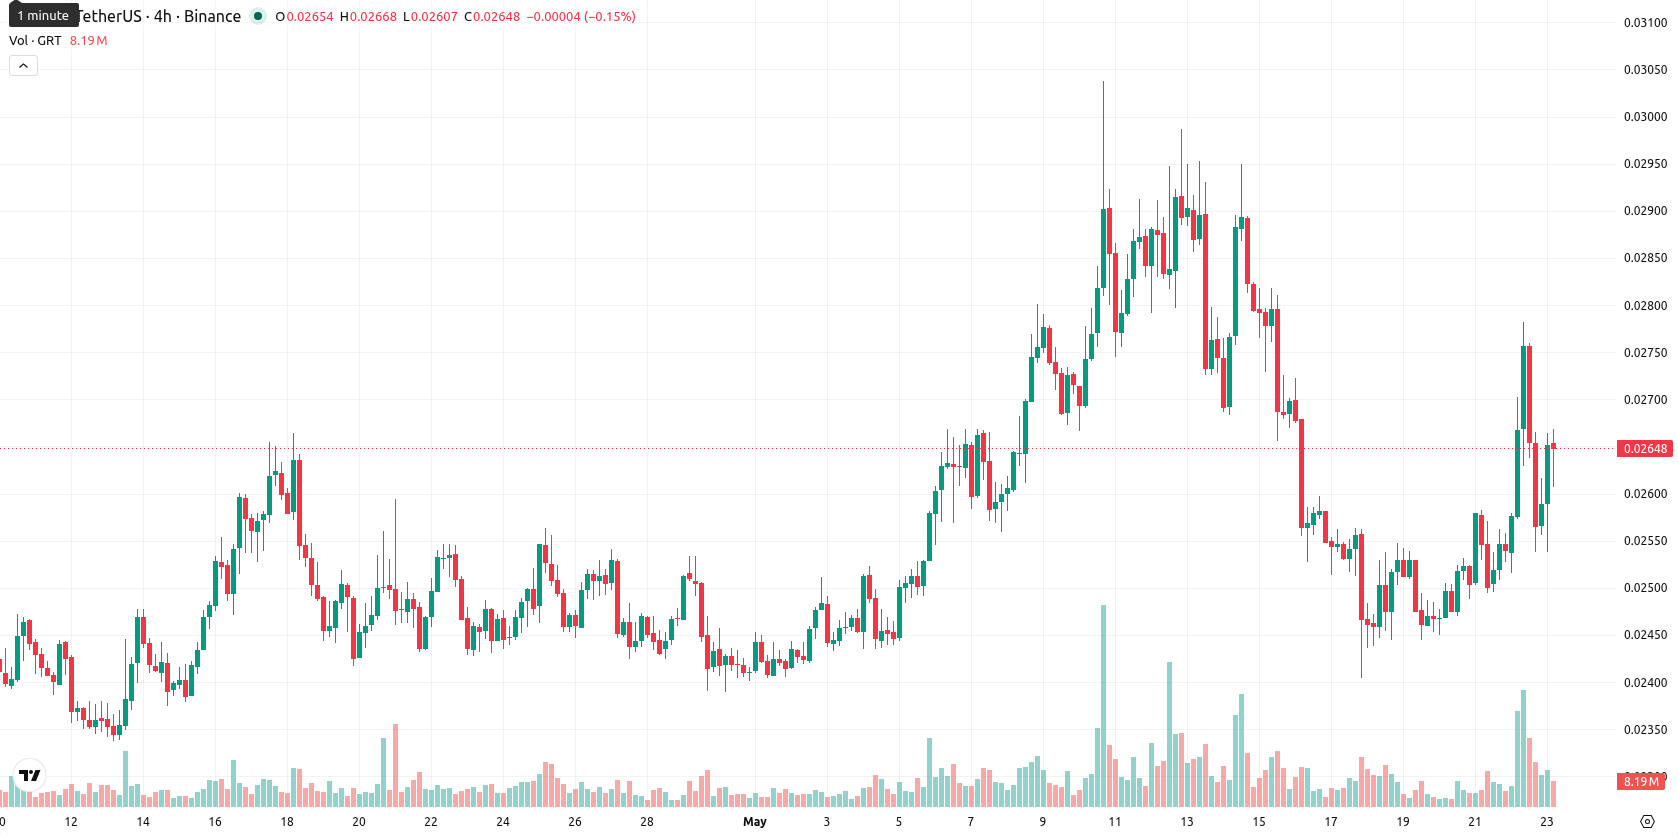
The Graph (GRT) is trading at $0.026698, representing a $0.0005 (1.75%) gain over the past week. This leaves GRT below its weekly MA-20 ($0.02771550), MA-50 ($0.05616360), and MA-200 ($0.12937440), indicating sustained medium- and long-term bearish pressure with the MA-20 forming the closest resistance.
Highlights
- GRT remains in a medium- and long-term bearish trend, trading below key moving averages with negative weekly momentum signals.
- Short-term indicators are mixed, with weak trend momentum but an overbought Stochastic RSI and localized buyer support evident.
- Expected trading range for the week is $0.02530 to $0.02810, with a much higher probability of consolidation or downside than a breakout.
Persistent negative momentum as technical signals reinforce caution this week
Technical analysis on the weekly timeframe shows momentum remains negative. The MACD is firmly in 'Strong Sell' territory and the ADX reads 'Sell' at 26.32, reflecting weak trend strength despite minor upward moves. The RSI sits at 35.37 ('Sell'), while the Stochastic RSI at 88.07 is 'Overbought', creating a short-term overbought setup despite weak underlying momentum. The Commodity Channel Index is neutral, and Bull/Bear Power signals a modest buyer presence. Current volatility is 15.72%, and price action has brought GRT into the upper part of its weekly range, but key moving averages and momentum indicators continue to signal caution.
Sideways outlook expected as bearish bias meets buyer support next week
Looking ahead, the most likely scenario for GRT over the coming 7 days is sideways movement between $0.02530 and $0.02810 as ongoing bearish momentum is countered by some local buying interest. Based on the weekly indicator setup, there is less than a 20% probability of a sustained upward move, as none of the four key weekly signals register as 'Buy'. A bullish exception could see a breakout above $0.02810 toward higher resistance, but this scenario is less favored. Conversely, a break below $0.02530 could trigger a renewed downside move to recent lows if selling pressure intensifies.
Earlier, analysts noted that The Graph was experiencing persistent bearish pressure despite intermittent signs of short-term momentum. The latest technical setup confirms the prevailing downside bias, and traders should monitor for a decisive move outside the $0.02530–$0.02810 consolidation range for signals of the next significant trend.


-
 Afghanistan
-
 Albania
-
 Algeria
-
 Angola
-
 Argentina
-
 Armenia
-
 Australia
-
 Austria
-
 Azerbaijan
-
 Bahamas
-
 Bahrain
-
 Bangladesh
-
 Belarus
-
 Belgium
-
 Bolivia
-
 Botswana
-
 Brazil
-
 Brunei
-
 Bulgaria
-
 Cambodia
-
 Cameroon
-
 Canada
-
 Chile
Chile
-
 China
China
-
 Colombia
-
 Congo
Congo
-
 Costa Rica
-
 Cote d'Ivoire
-
 Croatia
-
 Cuba
Cuba
-
 Cyprus
-
 Czechia
-
 DR Congo
-
 Denmark
-
 Dominican Republic
-
 Ecuador
-
 Egypt
Egypt
-
 El Salvador
-
 Estonia
-
 Eswatini
-
 Ethiopia
-
 Finland
-
 France
-
 Georgia
-
 Germany
-
 Ghana
Ghana
-
 Greece
-
 Haiti
Haiti
-
 Hong Kong
-
 Hungary
-
 India
India
-
 Indonesia
-
 Iran, Islamic republic
-
 Iraq
Iraq
-
 Ireland
-
 Israel
-
 Italy
Italy
-
 Jamaica
-
 Japan
Japan
-
 Jordan
-
 Kazakhstan
-
 Kenya
Kenya
-
 Korea
Korea
-
 Kuwait
-
 Kyrgyzstan
-
 Laos
Laos
-
 Latvia
-
 Lebanon
-
 Lesotho
-
 Libya
Libya
-
 Lithuania
-
 Luxembourg
-
 Madagascar
-
 Malaysia
-
 Malta
Malta
-
 Mauritius
-
 Mexico
-
 Moldova
-
 Mongolia
-
 Montenegro
-
 Morocco
-
 Mozambique
-
 Myanmar
-
 Namibia
-
 Nepal
Nepal
-
 Netherlands
-
 New Zealand
-
 Nigeria
-
 North Macedonia
-
 Norway
-
 Oman
Oman
-
 Pakistan
-
 Palestine
-
 Panama
-
 Papua New Guinea
-
 Paraguay
-
 Peru
Peru
-
 Philippines
-
 Poland
-
 Portugal
-
 Puerto Rico
-
 Qatar
Qatar
-
 Reunion
-
 Romania
-
 Rwanda
-
 Saudi Arabia
-
 Serbia
-
 Singapore
-
 Slovakia
-
 Slovenia
-
 Somalia
-
 South Africa
-
 Spain
Spain
-
 Sri Lanka
-
 Sweden
-
 Switzerland
-
 Syria
Syria
-
 Taiwan
-
 Tajikistan
-
 Tanzania
-
 Thailand
-
 Trinidad and Tobago
-
 Tunisia
-
 Turkey
-
 UAE
UAE
-
 Uganda
-
 Ukraine
-
 United Kingdom
-
United States
-
 Uruguay
-
 Uzbekistan
-
 Venezuela
-
 Vietnam
-
 Yemen
Yemen
-
 Zambia
-
 Zimbabwe
- Forex
- Crypto
