
CRV declines near $0.2278 amid persistent selling pressure signaled by MACD: weekly analysis

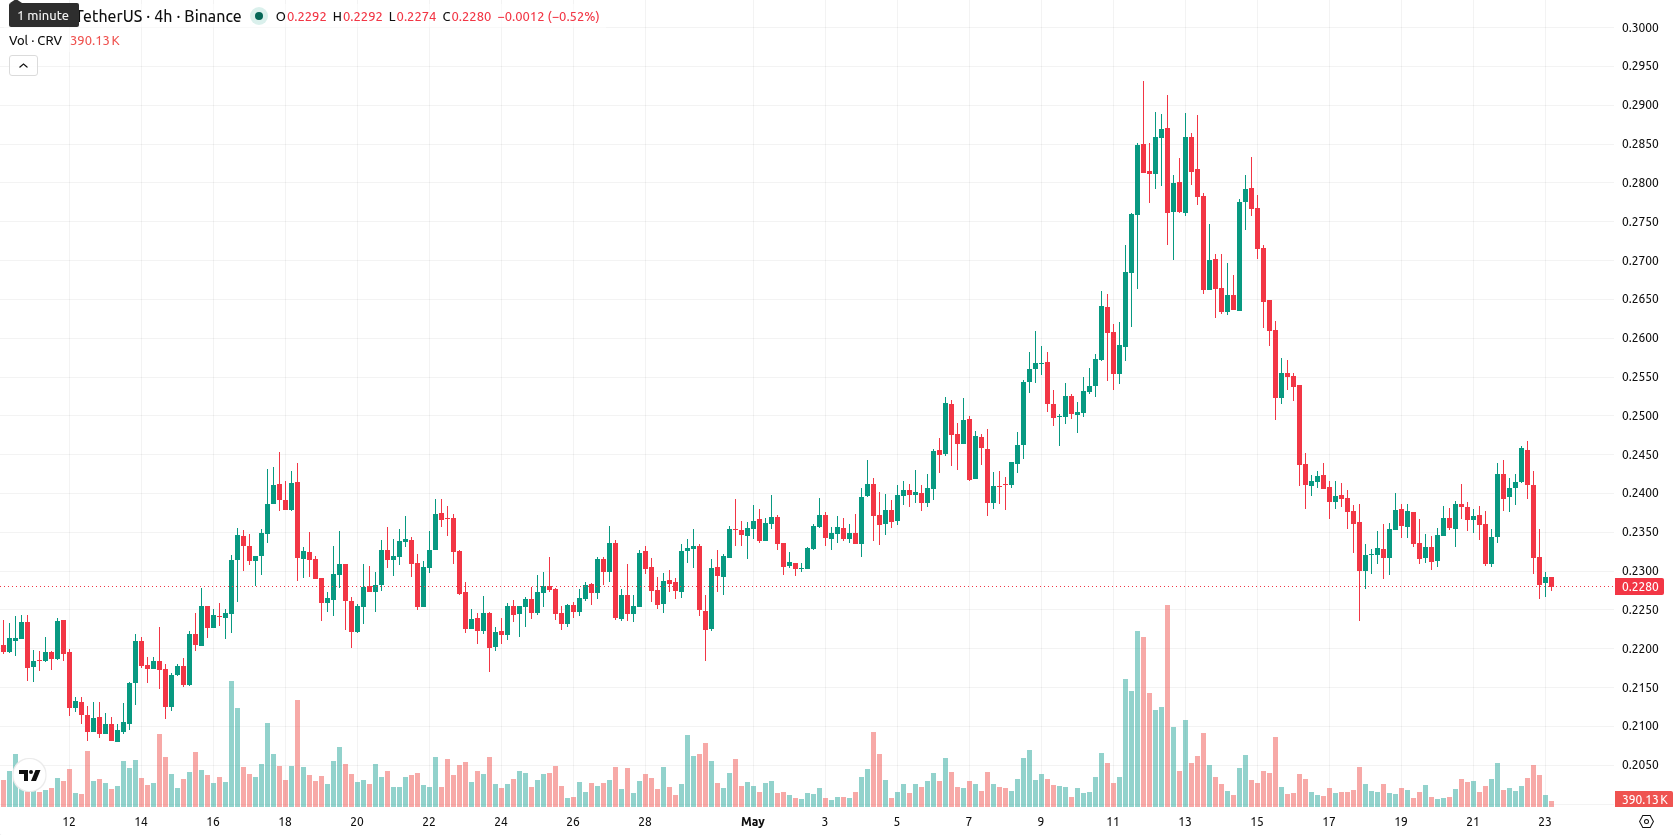
Curve DAO Token (CRV) is currently trading at $0.2278, marking a drop of $0.0218 or 8.65% over the past week. The token remains below its weekly MA-20 ($0.2567), MA-50 ($0.4797), and MA-200 ($0.6050), reflecting ongoing medium- and long-term bearish pressure as sellers dominate near the bottom of the weekly range.
Highlights
- CRV remains under persistent selling pressure, trading below major moving averages and holding near the bottom of its weekly range.
- Momentum indicators signal bearish conditions, with no buy triggers and weak buyer activity detected this week.
- Price is expected to fluctuate between $0.222 and $0.238 over the next 7 days, with a higher probability of further downside on a break below support.
Technical signals reinforce weak momentum and seller dominance this week
Weekly technical signals remain negative for CRV. The price closed well below all major moving averages on the W1 timeframe, with $0.222 acting as the nearest support and $0.238 as immediate resistance. RSI stands at 37, pointing to continued weak momentum but falling short of oversold, while both MACD and ADX indicate persistent selling activity. Other key oscillators such as Stochastic RSI and CCI remain neutral, and the Awesome Oscillator offers no clear trend, affirming a lack of buying impetus this week.
Narrow trading range expected as bearish momentum persists next week
For the next 7 days, CRV is expected to trade in a narrow corridor between $0.222 and $0.238. The weekly outlook remains bearish, given that no key indicators offer a buy signal and momentum is weak. There is a low probability (less than 20%) of a break above resistance, and the most likely outcome is further sideways movement or a bearish continuation should $0.222 be breached.
Earlier, analysts noted that Curve was experiencing persistent bearish momentum with limited prospects for an immediate recovery. Current weekly data reinforces this outlook, highlighting the importance of closely monitoring the $0.222 support level, as a break below it could accelerate downside risk in the days ahead.


-
 Afghanistan
-
 Albania
-
 Algeria
-
 Angola
-
 Argentina
-
 Armenia
-
 Australia
-
 Austria
-
 Azerbaijan
-
 Bahamas
-
 Bahrain
-
 Bangladesh
-
 Belarus
-
 Belgium
-
 Bolivia
-
 Botswana
-
 Brazil
-
 Brunei
-
 Bulgaria
-
 Cambodia
-
 Cameroon
-
 Canada
-
 Chile
Chile
-
 China
China
-
 Colombia
-
 Congo
Congo
-
 Costa Rica
-
 Cote d'Ivoire
-
 Croatia
-
 Cuba
Cuba
-
 Cyprus
-
 Czechia
-
 DR Congo
-
 Denmark
-
 Dominican Republic
-
 Ecuador
-
 Egypt
Egypt
-
 El Salvador
-
 Estonia
-
 Eswatini
-
 Ethiopia
-
 Finland
-
 France
-
 Georgia
-
 Germany
-
 Ghana
Ghana
-
 Greece
-
 Haiti
Haiti
-
 Hong Kong
-
 Hungary
-
 India
India
-
 Indonesia
-
 Iran, Islamic republic
-
 Iraq
Iraq
-
 Ireland
-
 Israel
-
 Italy
Italy
-
 Jamaica
-
 Japan
Japan
-
 Jordan
-
 Kazakhstan
-
 Kenya
Kenya
-
 Korea
Korea
-
 Kuwait
-
 Kyrgyzstan
-
 Laos
Laos
-
 Latvia
-
 Lebanon
-
 Lesotho
-
 Libya
Libya
-
 Lithuania
-
 Luxembourg
-
 Madagascar
-
 Malaysia
-
 Malta
Malta
-
 Mauritius
-
 Mexico
-
 Moldova
-
 Mongolia
-
 Montenegro
-
 Morocco
-
 Mozambique
-
 Myanmar
-
 Namibia
-
 Nepal
Nepal
-
 Netherlands
-
 New Zealand
-
 Nigeria
-
 North Macedonia
-
 Norway
-
 Oman
Oman
-
 Pakistan
-
 Palestine
-
 Panama
-
 Papua New Guinea
-
 Paraguay
-
 Peru
Peru
-
 Philippines
-
 Poland
-
 Portugal
-
 Puerto Rico
-
 Qatar
Qatar
-
 Reunion
-
 Romania
-
 Rwanda
-
 Saudi Arabia
-
 Serbia
-
 Singapore
-
 Slovakia
-
 Slovenia
-
 Somalia
-
 South Africa
-
 Spain
Spain
-
 Sri Lanka
-
 Sweden
-
 Switzerland
-
 Syria
Syria
-
 Taiwan
-
 Tajikistan
-
 Tanzania
-
 Thailand
-
 Trinidad and Tobago
-
 Tunisia
-
 Turkey
-
 UAE
UAE
-
 Uganda
-
 Ukraine
-
 United Kingdom
-
United States
-
 Uruguay
-
 Uzbekistan
-
 Venezuela
-
 Vietnam
-
 Yemen
Yemen
-
 Zambia
-
 Zimbabwe
- Forex
- Crypto
