
Curve price prediction: Is $0.2400 support holding as CRV sheds 7.53%?

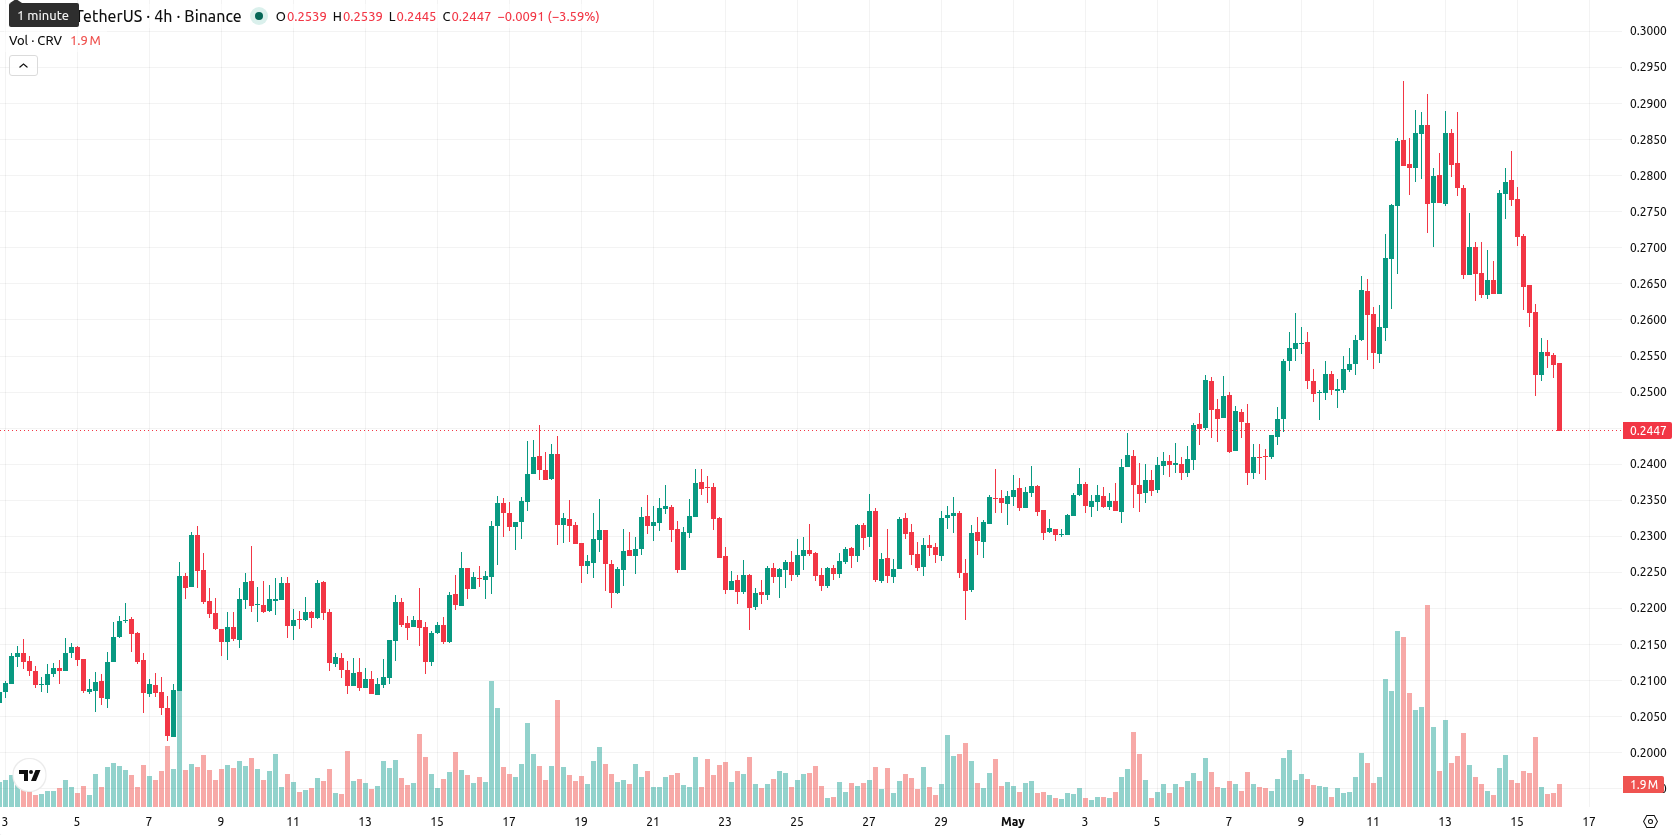
Curve (CRV) is trading at $0.2457, recording a daily decline of 7.53%. The price is positioned just below its short-term moving averages, reflecting recent downward pressure.
Highlights
- CRV faces persistent short-term selling pressure, trading below key moving averages and exhibiting sharply increased intraday volatility.
- Momentum indicators are mixed, with mild bullish daily signals offset by weak trend conviction and pronounced oversold intraday conditions.
- Next week’s expected range is $0.2400–$0.2600, with a higher likelihood of further downside if $0.2400 support fails.
Bullish signals tempered by weak momentum and persistent volatility
CRV is trading just below the SMA-20 ($0.2474), above the SMA-50 ($0.2306), and well below the SMA-200 ($0.3184). The Ichimoku Kijun sits at $0.2551, providing immediate resistance. Technical momentum is mixed: MACD is giving a daily buy signal, while ADX indicates weak directional strength. RSI stands at 53 and CCI is above 60, both reflecting mild bullish momentum; however, the Stoch RSI at zero signals an oversold short-term condition. Bull/Bear Power (BBP) remains positive, suggesting buyer presence, and the Awesome Oscillator confirms modest upward bias. Despite some bullish signals, intraday trading has shown persistent seller control amid high volatility.
Downside bias persists as probability of rebound remains low
Looking ahead, CRV is expected to fluctuate within a volatility band of $0.2400–$0.2600 over the coming week. With no weekly buy signals from major indicators, the probability of an upward move is very low (less than 20%), making further downside more likely. The baseline scenario anticipates consolidation between $0.2400 and immediate resistance at $0.2550. A break above $0.2550 could open the way to $0.2600 or higher, while a failure to hold $0.2400 may accelerate declines to new lows.
Earlier, analysts noted that Curve was experiencing persistent bearish momentum and limited prospects for an immediate recovery. While the current analysis acknowledges some emerging bullish signals, high volatility and the lack of decisive weekly buy indicators mean that traders should focus on $0.2400 as a critical support, with any sustained move below this level likely to accelerate downside risk.


-
 Afghanistan
-
 Albania
-
 Algeria
-
 Angola
-
 Argentina
-
 Armenia
-
 Australia
-
 Austria
-
 Azerbaijan
-
 Bahamas
-
 Bahrain
-
 Bangladesh
-
 Belarus
-
 Belgium
-
 Bolivia
-
 Botswana
-
 Brazil
-
 Brunei
-
 Bulgaria
-
 Cambodia
-
 Cameroon
-
 Canada
-
 Chile
Chile
-
 China
China
-
 Colombia
-
 Congo
Congo
-
 Costa Rica
-
 Cote d'Ivoire
-
 Croatia
-
 Cuba
Cuba
-
 Cyprus
-
 Czechia
-
 DR Congo
-
 Denmark
-
 Dominican Republic
-
 Ecuador
-
 Egypt
Egypt
-
 El Salvador
-
 Estonia
-
 Eswatini
-
 Ethiopia
-
 Finland
-
 France
-
 Georgia
-
 Germany
-
 Ghana
Ghana
-
 Greece
-
 Haiti
Haiti
-
 Hong Kong
-
 Hungary
-
 India
India
-
 Indonesia
-
 Iran, Islamic republic
-
 Iraq
Iraq
-
 Ireland
-
 Israel
-
 Italy
Italy
-
 Jamaica
-
 Japan
Japan
-
 Jordan
-
 Kazakhstan
-
 Kenya
Kenya
-
 Korea
Korea
-
 Kuwait
-
 Kyrgyzstan
-
 Laos
Laos
-
 Latvia
-
 Lebanon
-
 Lesotho
-
 Libya
Libya
-
 Lithuania
-
 Luxembourg
-
 Madagascar
-
 Malaysia
-
 Malta
Malta
-
 Mauritius
-
 Mexico
-
 Moldova
-
 Mongolia
-
 Montenegro
-
 Morocco
-
 Mozambique
-
 Myanmar
-
 Namibia
-
 Nepal
Nepal
-
 Netherlands
-
 New Zealand
-
 Nigeria
-
 North Macedonia
-
 Norway
-
 Oman
Oman
-
 Pakistan
-
 Palestine
-
 Panama
-
 Papua New Guinea
-
 Paraguay
-
 Peru
Peru
-
 Philippines
-
 Poland
-
 Portugal
-
 Puerto Rico
-
 Qatar
Qatar
-
 Reunion
-
 Romania
-
 Rwanda
-
 Saudi Arabia
-
 Serbia
-
 Singapore
-
 Slovakia
-
 Slovenia
-
 Somalia
-
 South Africa
-
 Spain
Spain
-
 Sri Lanka
-
 Sweden
-
 Switzerland
-
 Syria
Syria
-
 Taiwan
-
 Tajikistan
-
 Tanzania
-
 Thailand
-
 Trinidad and Tobago
-
 Tunisia
-
 Turkey
-
 UAE
UAE
-
 Uganda
-
 Ukraine
-
 United Kingdom
-
United States
-
 Uruguay
-
 Uzbekistan
-
 Venezuela
-
 Vietnam
-
 Yemen
Yemen
-
 Zambia
-
 Zimbabwe
- Forex
- Crypto
