
Dogecoin holds near $0.10 support as institutional long positions increase: weekly analysis

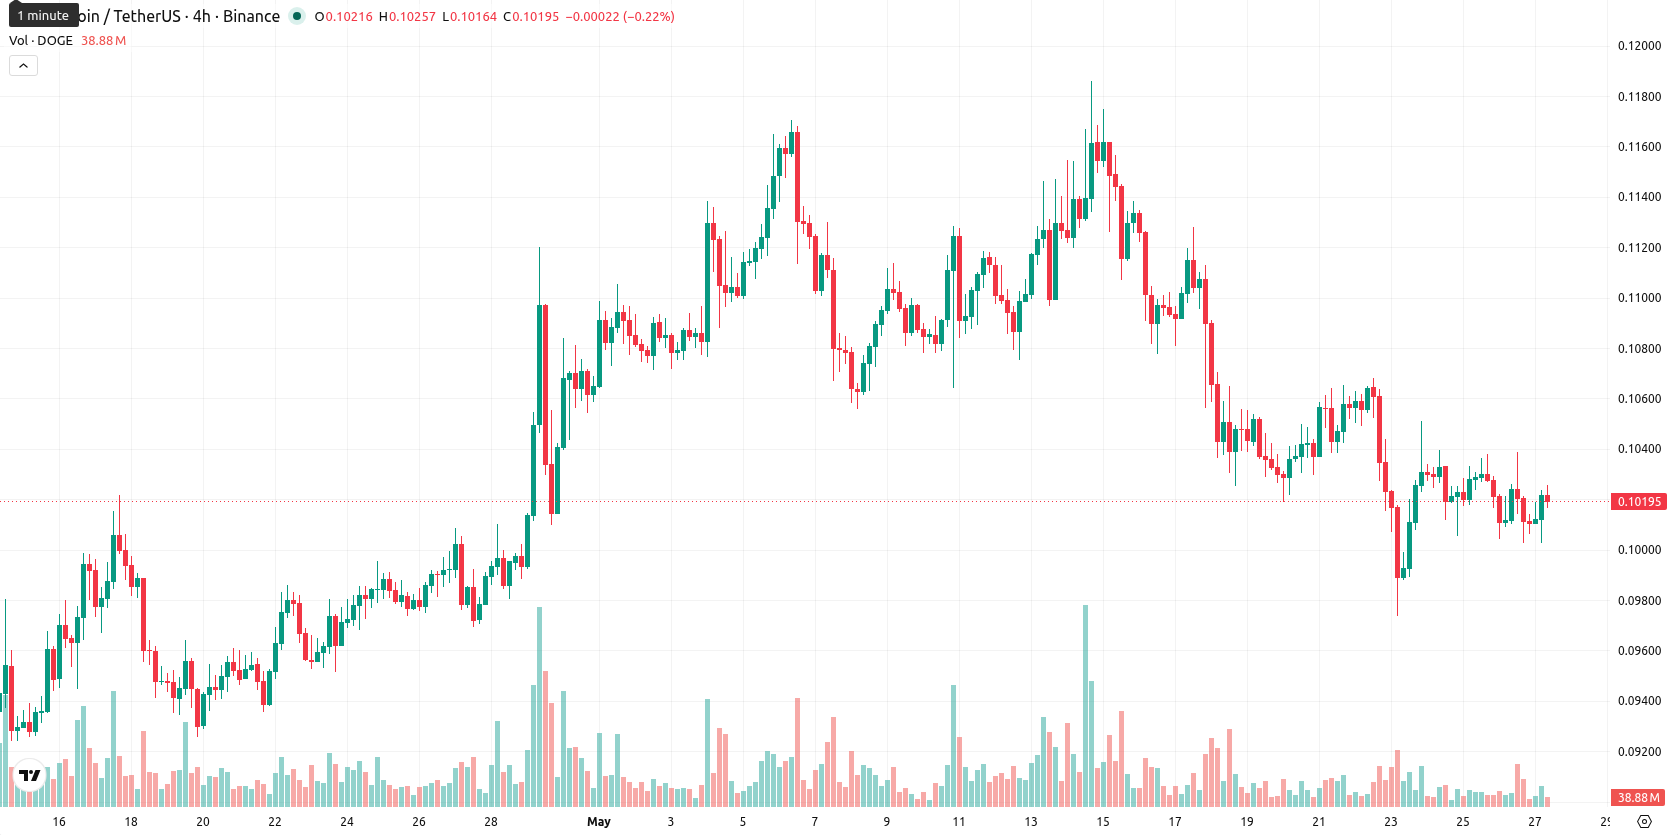
Dogecoin (DOGE) is currently trading slightly above its weekly MA-20 at $0.10089, but remains well below both the weekly MA-50 ($0.15666) and MA-200 ($0.13718) levels. Over the past week, DOGE has declined by $0.0018 (1.87%), with the price positioned in the middle of its weekly range and technicals indicating limited medium-term support below and persistent long-term selling pressure above.
Highlights
- Dogecoin trades just above short-term support but faces persistent long-term selling pressure, indicating limited bullish momentum.
- Momentum indicators remain bearish, with sellers dominating the trend and no key signals suggesting a reversal.
- Dogecoin is expected to move between $0.095 and $0.112 this week, with a higher probability of a continued decline.
Persistent institutional inflows contrast retail withdrawal during the week
Dogecoin saw four consecutive weeks of positive inflows into spot DOGE ETFs, reflecting consistent institutional interest despite overall market weakness. Large whale wallets initiated several multimillion-dollar long positions, highlighting sustained high-value trading activity even as retail engagement remained subdued. The asset’s circulating supply stands at approximately 154 billion coins, with ongoing issuance through mining, after Dogecoin's market capitalization was briefly surpassed by a sector peer.
Bearish momentum persists as technicals reinforce weekly downtrend
Weekly technical indicators remain firmly bearish, as the MACD shows a strong sell signal and the ADX confirms a weak, seller-driven trend. Both RSI and Bull/Bear Power reflect ongoing downside momentum, supporting sellers’ dominance. The price is sandwiched between the $0.095 weekly support and $0.112 resistance, while volatility remains elevated at 9.72%. Overall, the oscillators confirm a steady downtrend, with no clear signals of a reversal or divergence yet.
Range-bound outlook as momentum fails to support bullish reversal next week
For the next seven days, DOGE is expected to remain in a sideways corridor just above the $0.10 level, with a trading range of $0.095 to $0.112. The probability of a sustained rise is very low (less than 20%), given that none of the four key weekly indicators signal Buy or Strong Buy conditions. If DOGE breaks below the $0.095 support, further declines may follow as downside pressure persists, while a break above the $0.112 resistance would require a shift in weekly momentum to support a more bullish scenario.
Earlier, analysts noted that Dogecoin remained trapped in a consolidative trend with persistent bearish momentum and limited prospects for recovery. The current analysis reinforces this outlook, as fresh institutional inflows and large whale activity have yet to offset sustained technical weakness, making a decisive move above the $0.112 weekly resistance the key scenario to monitor for any potential trend reversal.


-
 Afghanistan
-
 Albania
-
 Algeria
-
 Angola
-
 Argentina
-
 Armenia
-
 Australia
-
 Austria
-
 Azerbaijan
-
 Bahamas
-
 Bahrain
-
 Bangladesh
-
 Belarus
-
 Belgium
-
 Bolivia
-
 Botswana
-
 Brazil
-
 Brunei
-
 Bulgaria
-
 Cambodia
-
 Cameroon
-
 Canada
-
 Chile
Chile
-
 China
China
-
 Colombia
-
 Congo
Congo
-
 Costa Rica
-
 Cote d'Ivoire
-
 Croatia
-
 Cuba
Cuba
-
 Cyprus
-
 Czechia
-
 DR Congo
-
 Denmark
-
 Dominican Republic
-
 Ecuador
-
 Egypt
Egypt
-
 El Salvador
-
 Estonia
-
 Eswatini
-
 Ethiopia
-
 Finland
-
 France
-
 Georgia
-
 Germany
-
 Ghana
Ghana
-
 Greece
-
 Haiti
Haiti
-
 Hong Kong
-
 Hungary
-
 India
India
-
 Indonesia
-
 Iran, Islamic republic
-
 Iraq
Iraq
-
 Ireland
-
 Israel
-
 Italy
Italy
-
 Jamaica
-
 Japan
Japan
-
 Jordan
-
 Kazakhstan
-
 Kenya
Kenya
-
 Korea
Korea
-
 Kuwait
-
 Kyrgyzstan
-
 Laos
Laos
-
 Latvia
-
 Lebanon
-
 Lesotho
-
 Libya
Libya
-
 Lithuania
-
 Luxembourg
-
 Madagascar
-
 Malaysia
-
 Malta
Malta
-
 Mauritius
-
 Mexico
-
 Moldova
-
 Mongolia
-
 Montenegro
-
 Morocco
-
 Mozambique
-
 Myanmar
-
 Namibia
-
 Nepal
Nepal
-
 Netherlands
-
 New Zealand
-
 Nigeria
-
 North Macedonia
-
 Norway
-
 Oman
Oman
-
 Pakistan
-
 Palestine
-
 Panama
-
 Papua New Guinea
-
 Paraguay
-
 Peru
Peru
-
 Philippines
-
 Poland
-
 Portugal
-
 Puerto Rico
-
 Qatar
Qatar
-
 Reunion
-
 Romania
-
 Rwanda
-
 Saudi Arabia
-
 Serbia
-
 Singapore
-
 Slovakia
-
 Slovenia
-
 Somalia
-
 South Africa
-
 Spain
Spain
-
 Sri Lanka
-
 Sweden
-
 Switzerland
-
 Syria
Syria
-
 Taiwan
-
 Tajikistan
-
 Tanzania
-
 Thailand
-
 Trinidad and Tobago
-
 Tunisia
-
 Turkey
-
 UAE
UAE
-
 Uganda
-
 Ukraine
-
 United Kingdom
-
United States
-
 Uruguay
-
 Uzbekistan
-
 Venezuela
-
 Vietnam
-
 Yemen
Yemen
-
 Zambia
-
 Zimbabwe
- Forex
- Crypto
