
Shiba Inu extends losses as oversold RSI shows no bullish divergence: weekly review

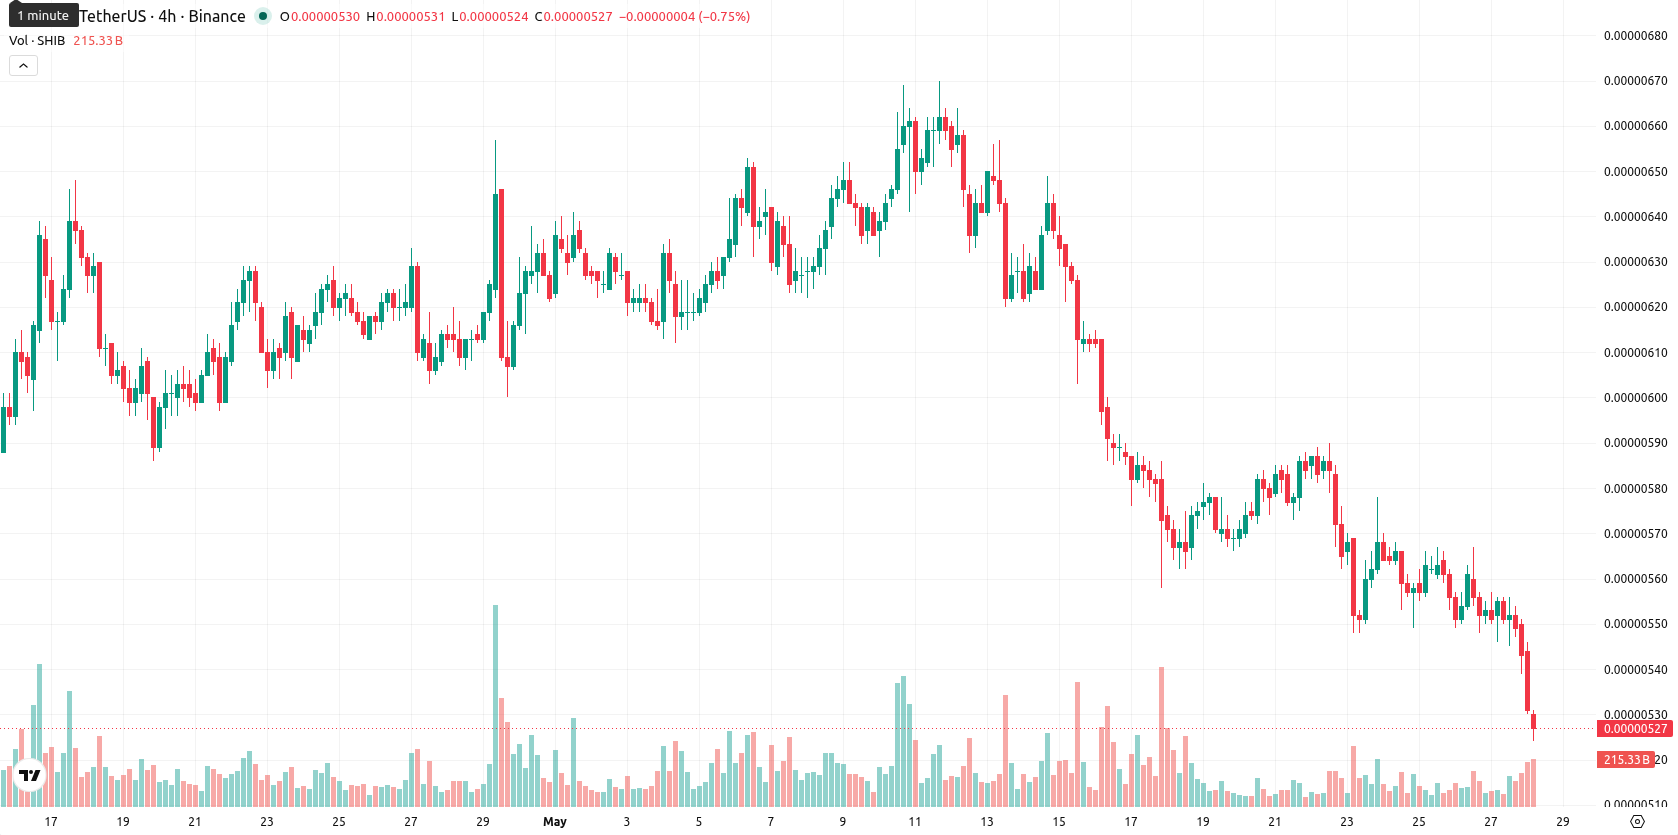
Shiba Inu Coin (SHIB) is trading at $0.0000053, reflecting a decrease of $0.000001 or 9.62% over the last week. SHIB remains well below its weekly MA-20 ($0.00000613), MA-50 ($0.00000905), and MA-200 ($0.00001275), highlighting continued medium- and long-term bearish pressure with the MA-20 acting as nearby dynamic resistance.
Highlights
- SHIB continues in a medium- and long-term downtrend, trading below all major moving average resistance levels.
- Key momentum indicators such as MACD, RSI, and ADX confirm sustained bearish pressure and weak trend strength, with no bullish divergence present.
- SHIB is forecasted to remain between $0.00000515 and $0.00000580 over the next week, with a low probability of a breakout above resistance.
Selling pressure intensifies as weekly indicators confirm sustained bearishness
Weekly technical analysis confirms ongoing negative momentum for SHIB. The MACD on the W1 chart signals a strong sell, while a low ADX shows weak trend strength. Both the RSI and CCI are in oversold territory, with the Stochastic RSI trending toward oversold on lower timeframes. Seller dominance is reinforced by persistent bear power, and the Awesome Oscillator gives a neutral reading that fails to counter the prevailing downtrend. SHIB is sitting at the bottom of its weekly range with volatility at 9.28% and no signs of bullish divergence.
Limited rebound prospects as bearish signals define next week's range
For the next 7 days, SHIB is expected to trade between $0.00000515 and $0.00000580, mirroring the week's volatility and sustained bearish sentiment. The probability of an upside move remains very low (less than 20%), as all four key indicators signal bearish or neutral momentum. The baseline expectation is for price stabilization within this narrow band. However, a break below $0.00000515 could open further downside risks, while a bullish reversal would require a move above $0.00000580, which current signals do not support.
Earlier, analysts noted that Shiba Inu remained entrenched in a bearish trend as technicals consistently favored sellers. This outlook is reinforced by fresh oversold signals and sustained negative momentum, with heightened downside risk if SHIB falls below $0.00000515 in the coming week.


-
 Afghanistan
-
 Albania
-
 Algeria
-
 Angola
-
 Argentina
-
 Armenia
-
 Australia
-
 Austria
-
 Azerbaijan
-
 Bahamas
-
 Bahrain
-
 Bangladesh
-
 Belarus
-
 Belgium
-
 Bolivia
-
 Botswana
-
 Brazil
-
 Brunei
-
 Bulgaria
-
 Cambodia
-
 Cameroon
-
 Canada
-
 Chile
Chile
-
 China
China
-
 Colombia
-
 Congo
Congo
-
 Costa Rica
-
 Cote d'Ivoire
-
 Croatia
-
 Cuba
Cuba
-
 Cyprus
-
 Czechia
-
 DR Congo
-
 Denmark
-
 Dominican Republic
-
 Ecuador
-
 Egypt
Egypt
-
 El Salvador
-
 Estonia
-
 Eswatini
-
 Ethiopia
-
 Finland
-
 France
-
 Georgia
-
 Germany
-
 Ghana
Ghana
-
 Greece
-
 Haiti
Haiti
-
 Hong Kong
-
 Hungary
-
 India
India
-
 Indonesia
-
 Iran, Islamic republic
-
 Iraq
Iraq
-
 Ireland
-
 Israel
-
 Italy
Italy
-
 Jamaica
-
 Japan
Japan
-
 Jordan
-
 Kazakhstan
-
 Kenya
Kenya
-
 Korea
Korea
-
 Kuwait
-
 Kyrgyzstan
-
 Laos
Laos
-
 Latvia
-
 Lebanon
-
 Lesotho
-
 Libya
Libya
-
 Lithuania
-
 Luxembourg
-
 Madagascar
-
 Malaysia
-
 Malta
Malta
-
 Mauritius
-
 Mexico
-
 Moldova
-
 Mongolia
-
 Montenegro
-
 Morocco
-
 Mozambique
-
 Myanmar
-
 Namibia
-
 Nepal
Nepal
-
 Netherlands
-
 New Zealand
-
 Nigeria
-
 North Macedonia
-
 Norway
-
 Oman
Oman
-
 Pakistan
-
 Palestine
-
 Panama
-
 Papua New Guinea
-
 Paraguay
-
 Peru
Peru
-
 Philippines
-
 Poland
-
 Portugal
-
 Puerto Rico
-
 Qatar
Qatar
-
 Reunion
-
 Romania
-
 Rwanda
-
 Saudi Arabia
-
 Serbia
-
 Singapore
-
 Slovakia
-
 Slovenia
-
 Somalia
-
 South Africa
-
 Spain
Spain
-
 Sri Lanka
-
 Sweden
-
 Switzerland
-
 Syria
Syria
-
 Taiwan
-
 Tajikistan
-
 Tanzania
-
 Thailand
-
 Trinidad and Tobago
-
 Tunisia
-
 Turkey
-
 UAE
UAE
-
 Uganda
-
 Ukraine
-
 United Kingdom
-
United States
-
 Uruguay
-
 Uzbekistan
-
 Venezuela
-
 Vietnam
-
 Yemen
Yemen
-
 Zambia
-
 Zimbabwe
- Forex
- Crypto
