
The Graph slides as trading stays well below long-term average levels

The Graph (GRT) is trading at $0.02631, down 7.33% on the day. The price sits just below its key short-term average while remaining above medium-term trends, suggesting an ongoing consolidation pattern.
Highlights
- GRT is consolidating short term, with price caught between recent buyer interest and persistent long-term bearish pressure.
- Mixed momentum indicators and conflicting oscillator signals highlight elevated market uncertainty and intraday volatility for GRT.
- The expected weekly range is $0.02580–$0.02700, with further downside likely unless resistance at $0.02721 is decisively breached.
Indicator divergence heightens uncertainty after sharp intraday move
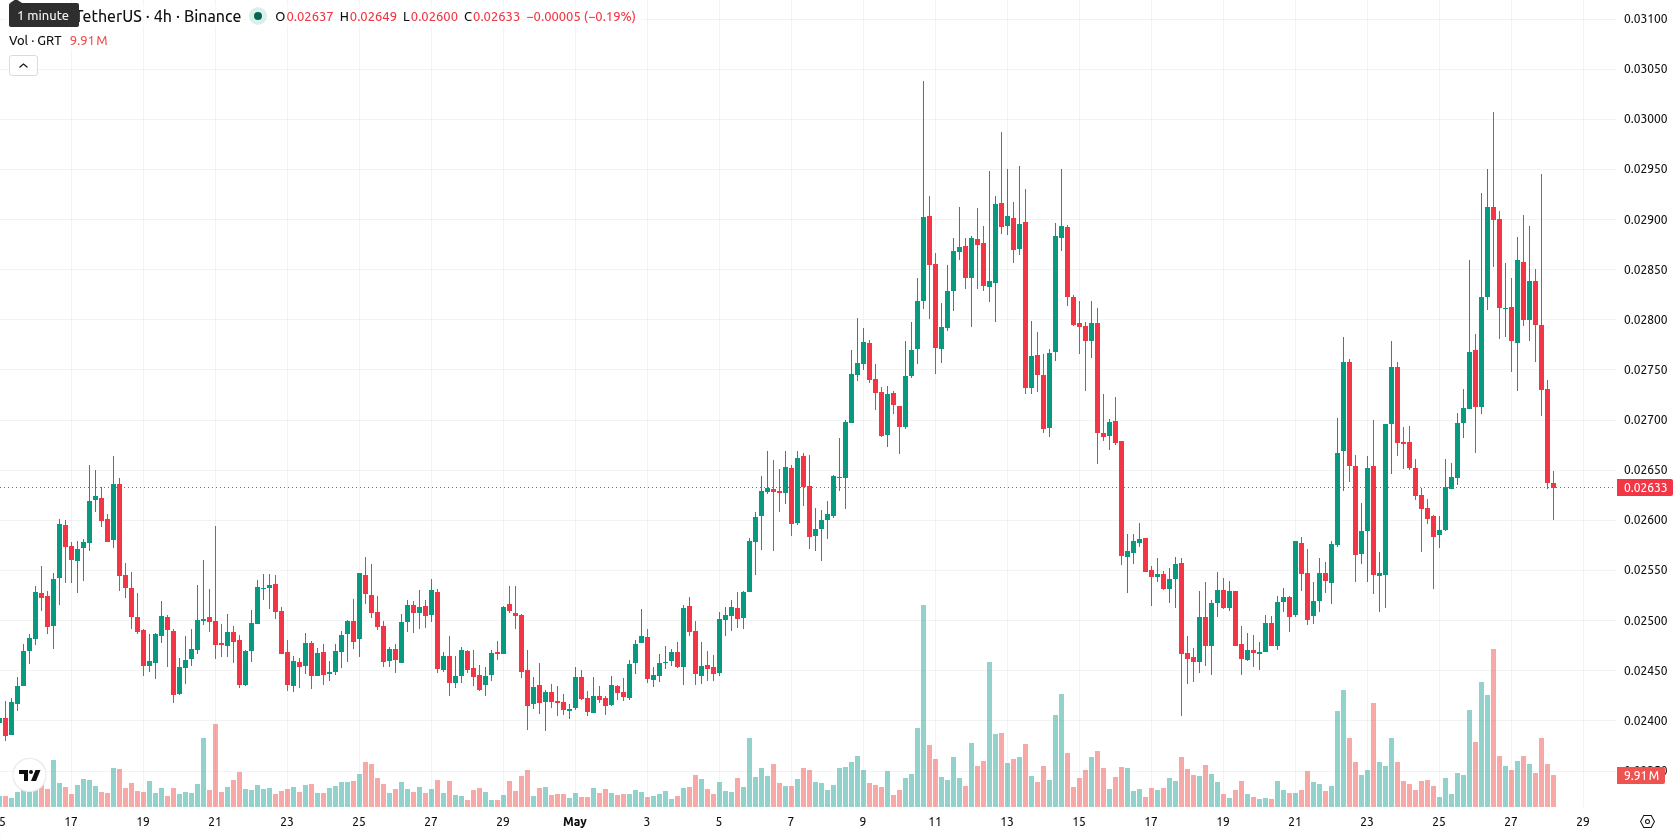
Technically, GRT is trading slightly below the SMA-20 at $0.02675, but above the SMA-50 at $0.02555; it remains well below the SMA-200, which stands at $0.03342. The D1 Ichimoku Kijun serves as immediate resistance at $0.02721. Daily technical signals reflect mixed momentum: the MACD and ADX both indicate ongoing buyer interest, while Stoch RSI flashes a strong sell signal. CCI and RSI readings are moderately bullish, Bull/Bear Power is slightly positive intraday, and the Awesome Oscillator is supportive. Today’s trade ranged from $0.02596 to $0.02736, with the price now near session lows after a volatile selloff from the open. Divergence among oscillators and momentum indicators points to heightened uncertainty, as the magnitude of the intraday drop is not universally affirmed by trend-following metrics.
Downside risk persists as sideways bias dominates price outlook
In the near term, the weekly trading band is expected between $0.02580 and $0.02700, reflecting typical volatility around the current level. There is a low probability of a sustained upside break, while the likelihood of further declines remains elevated barring a rebound above initial resistance at $0.02721. The baseline scenario remains sideways movement; a break below $0.02580 would expose GRT to additional downside, while a close above $0.02721 could catalyze a reversal if buyer momentum emerges.
Earlier, analysts noted that The Graph was exhibiting constructive short-term momentum while remaining constrained by longer-term resistance. The latest price action, marked by heightened volatility and a shift to consolidation just below key averages, introduces a new phase of uncertainty; traders should closely monitor the $0.02721 level as a potential pivot for either renewed upside or deeper declines.


-
 Afghanistan
-
 Albania
-
 Algeria
-
 Angola
-
 Argentina
-
 Armenia
-
 Australia
-
 Austria
-
 Azerbaijan
-
 Bahamas
-
 Bahrain
-
 Bangladesh
-
 Belarus
-
 Belgium
-
 Bolivia
-
 Botswana
-
 Brazil
-
 Brunei
-
 Bulgaria
-
 Cambodia
-
 Cameroon
-
 Canada
-
 Chile
Chile
-
 China
China
-
 Colombia
-
 Congo
Congo
-
 Costa Rica
-
 Cote d'Ivoire
-
 Croatia
-
 Cuba
Cuba
-
 Cyprus
-
 Czechia
-
 DR Congo
-
 Denmark
-
 Dominican Republic
-
 Ecuador
-
 Egypt
Egypt
-
 El Salvador
-
 Estonia
-
 Eswatini
-
 Ethiopia
-
 Finland
-
 France
-
 Georgia
-
 Germany
-
 Ghana
Ghana
-
 Greece
-
 Haiti
Haiti
-
 Hong Kong
-
 Hungary
-
 India
India
-
 Indonesia
-
 Iran, Islamic republic
-
 Iraq
Iraq
-
 Ireland
-
 Israel
-
 Italy
Italy
-
 Jamaica
-
 Japan
Japan
-
 Jordan
-
 Kazakhstan
-
 Kenya
Kenya
-
 Korea
Korea
-
 Kuwait
-
 Kyrgyzstan
-
 Laos
Laos
-
 Latvia
-
 Lebanon
-
 Lesotho
-
 Libya
Libya
-
 Lithuania
-
 Luxembourg
-
 Madagascar
-
 Malaysia
-
 Malta
Malta
-
 Mauritius
-
 Mexico
-
 Moldova
-
 Mongolia
-
 Montenegro
-
 Morocco
-
 Mozambique
-
 Myanmar
-
 Namibia
-
 Nepal
Nepal
-
 Netherlands
-
 New Zealand
-
 Nigeria
-
 North Macedonia
-
 Norway
-
 Oman
Oman
-
 Pakistan
-
 Palestine
-
 Panama
-
 Papua New Guinea
-
 Paraguay
-
 Peru
Peru
-
 Philippines
-
 Poland
-
 Portugal
-
 Puerto Rico
-
 Qatar
Qatar
-
 Reunion
-
 Romania
-
 Rwanda
-
 Saudi Arabia
-
 Serbia
-
 Singapore
-
 Slovakia
-
 Slovenia
-
 Somalia
-
 South Africa
-
 Spain
Spain
-
 Sri Lanka
-
 Sweden
-
 Switzerland
-
 Syria
Syria
-
 Taiwan
-
 Tajikistan
-
 Tanzania
-
 Thailand
-
 Trinidad and Tobago
-
 Tunisia
-
 Turkey
-
 UAE
UAE
-
 Uganda
-
 Ukraine
-
 United Kingdom
-
United States
-
 Uruguay
-
 Uzbekistan
-
 Venezuela
-
 Vietnam
-
 Yemen
Yemen
-
 Zambia
-
 Zimbabwe
- Forex
- Crypto
