
The Graph faces sustained pressure as MACD issues strong sell signal: weekly analysis

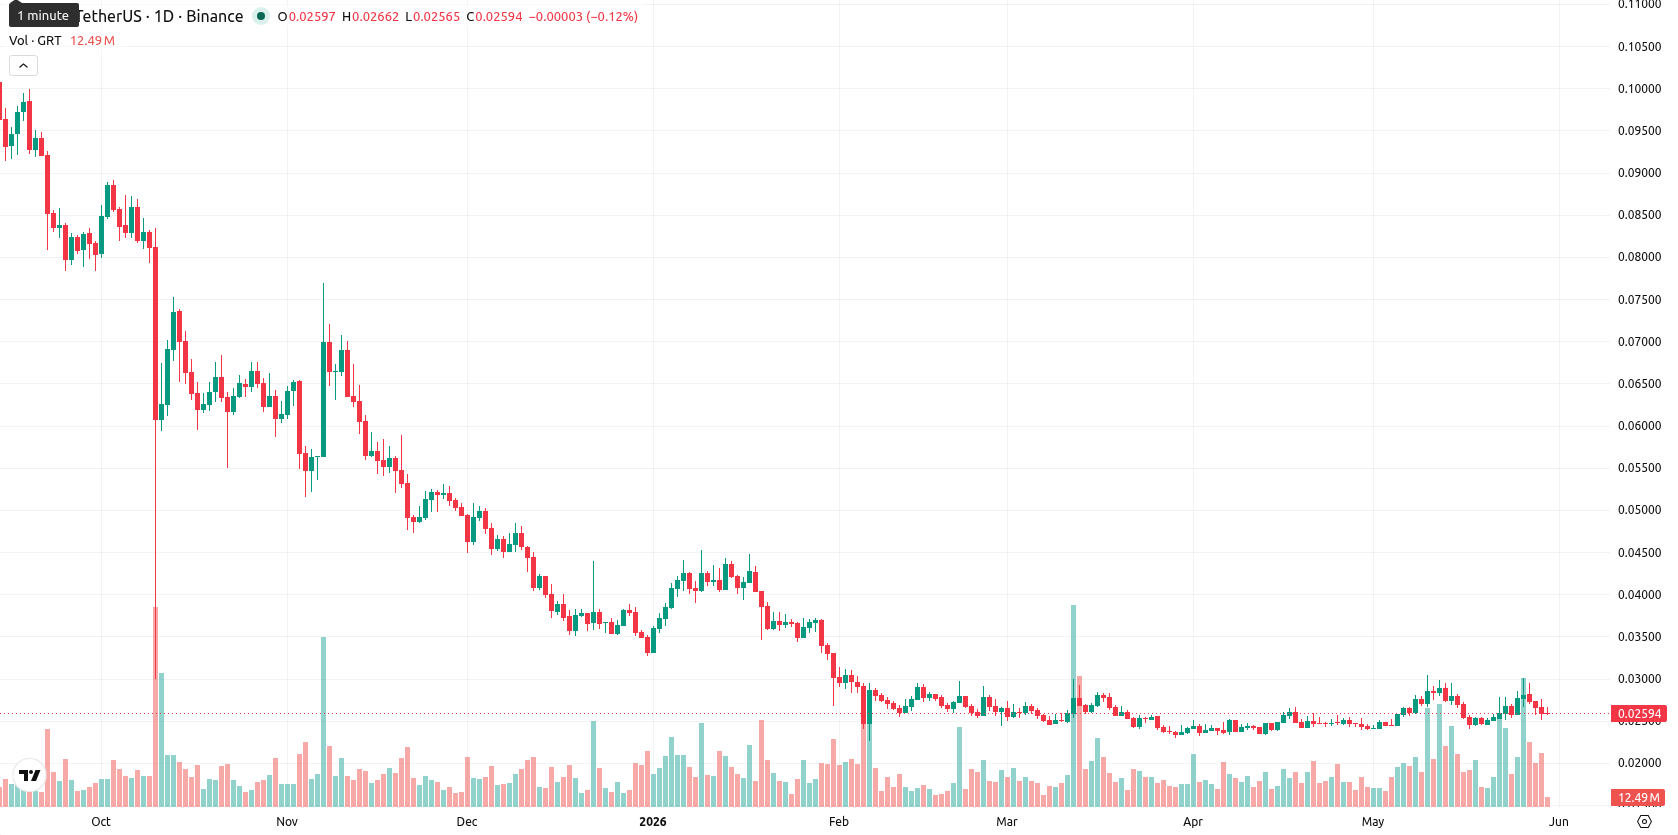
The Graph (GRT) has declined $0.0005 (2.00%) over the past week, currently trading at the bottom of its weekly range. GRT is positioned well below its MA-20 ($0.02691390), MA-50 ($0.05494576), and MA-200 ($0.12886244) on the weekly timeframe, signaling sustained bearish momentum.
Highlights
- GRT remains under sustained bearish pressure, trading decisively below all major weekly moving averages.
- Momentum indicators show strong bearish signals and further downside risk, despite minor recent buying interest.
- Price is likely to consolidate in a narrow channel between $0.02505 and $0.0271, with low probability of a breakout.
Bearish momentum dominates as signals favor sellers over the week
Weekly technical analysis points to ongoing bearish momentum for GRT. The asset remains below its key weekly moving averages, with the MA-20 representing the nearest dynamic resistance. MACD gives a strong sell signal and ADX also indicates clear bearish strength. RSI sits at 35, suggesting room for further downside, while the Stochastic RSI is overbought and the CCI is neutral. Notably, Bull/Bear Power is showing a small shift toward buying activity, indicating some emerging buyer interest despite the dominant negative signals.
Rangebound outlook favored as upside breakout risk stays muted
For the next 7 days, GRT is likely to consolidate in a narrow range between $0.02505 and $0.0271, in line with historical weekly volatility. The probability of a significant upside move is low — less than 20% — as no key indicators give a buy signal. The baseline scenario sees the price stabilize or drift sideways near recent lows. Only a strong break above $0.0271 would invalidate the bearish trend, while renewed selling could see GRT test $0.02505 or lower.
Earlier, analysts noted that The Graph was experiencing heightened uncertainty with a prevailing risk of further weakness, as technical signals suggested ongoing bearish pressure. This week’s persistent negative momentum and new signs of tentative buyer interest reinforce the likelihood of continued consolidation, making monitoring for a decisive move above dynamic resistance essential for any shift in market direction.


-
 Afghanistan
-
 Albania
-
 Algeria
-
 Angola
-
 Argentina
-
 Armenia
-
 Australia
-
 Austria
-
 Azerbaijan
-
 Bahamas
-
 Bahrain
-
 Bangladesh
-
 Belarus
-
 Belgium
-
 Bolivia
-
 Botswana
-
 Brazil
-
 Brunei
-
 Bulgaria
-
 Cambodia
-
 Cameroon
-
 Canada
-
 Chile
Chile
-
 China
China
-
 Colombia
-
 Congo
Congo
-
 Costa Rica
-
 Cote d'Ivoire
-
 Croatia
-
 Cuba
Cuba
-
 Cyprus
-
 Czechia
-
 DR Congo
-
 Denmark
-
 Dominican Republic
-
 Ecuador
-
 Egypt
Egypt
-
 El Salvador
-
 Estonia
-
 Eswatini
-
 Ethiopia
-
 Finland
-
 France
-
 Georgia
-
 Germany
-
 Ghana
Ghana
-
 Greece
-
 Haiti
Haiti
-
 Hong Kong
-
 Hungary
-
 India
India
-
 Indonesia
-
 Iran, Islamic republic
-
 Iraq
Iraq
-
 Ireland
-
 Israel
-
 Italy
Italy
-
 Jamaica
-
 Japan
Japan
-
 Jordan
-
 Kazakhstan
-
 Kenya
Kenya
-
 Korea
Korea
-
 Kuwait
-
 Kyrgyzstan
-
 Laos
Laos
-
 Latvia
-
 Lebanon
-
 Lesotho
-
 Libya
Libya
-
 Lithuania
-
 Luxembourg
-
 Madagascar
-
 Malaysia
-
 Malta
Malta
-
 Mauritius
-
 Mexico
-
 Moldova
-
 Mongolia
-
 Montenegro
-
 Morocco
-
 Mozambique
-
 Myanmar
-
 Namibia
-
 Nepal
Nepal
-
 Netherlands
-
 New Zealand
-
 Nigeria
-
 North Macedonia
-
 Norway
-
 Oman
Oman
-
 Pakistan
-
 Palestine
-
 Panama
-
 Papua New Guinea
-
 Paraguay
-
 Peru
Peru
-
 Philippines
-
 Poland
-
 Portugal
-
 Puerto Rico
-
 Qatar
Qatar
-
 Reunion
-
 Romania
-
 Rwanda
-
 Saudi Arabia
-
 Serbia
-
 Singapore
-
 Slovakia
-
 Slovenia
-
 Somalia
-
 South Africa
-
 Spain
Spain
-
 Sri Lanka
-
 Sweden
-
 Switzerland
-
 Syria
Syria
-
 Taiwan
-
 Tajikistan
-
 Tanzania
-
 Thailand
-
 Trinidad and Tobago
-
 Tunisia
-
 Turkey
-
 UAE
UAE
-
 Uganda
-
 Ukraine
-
 United Kingdom
-
United States
-
 Uruguay
-
 Uzbekistan
-
 Venezuela
-
 Vietnam
-
 Yemen
Yemen
-
 Zambia
-
 Zimbabwe
- Forex
- Crypto
