
Celestia faces resistance at $0.43 as only one oscillator signals buy: weekly review

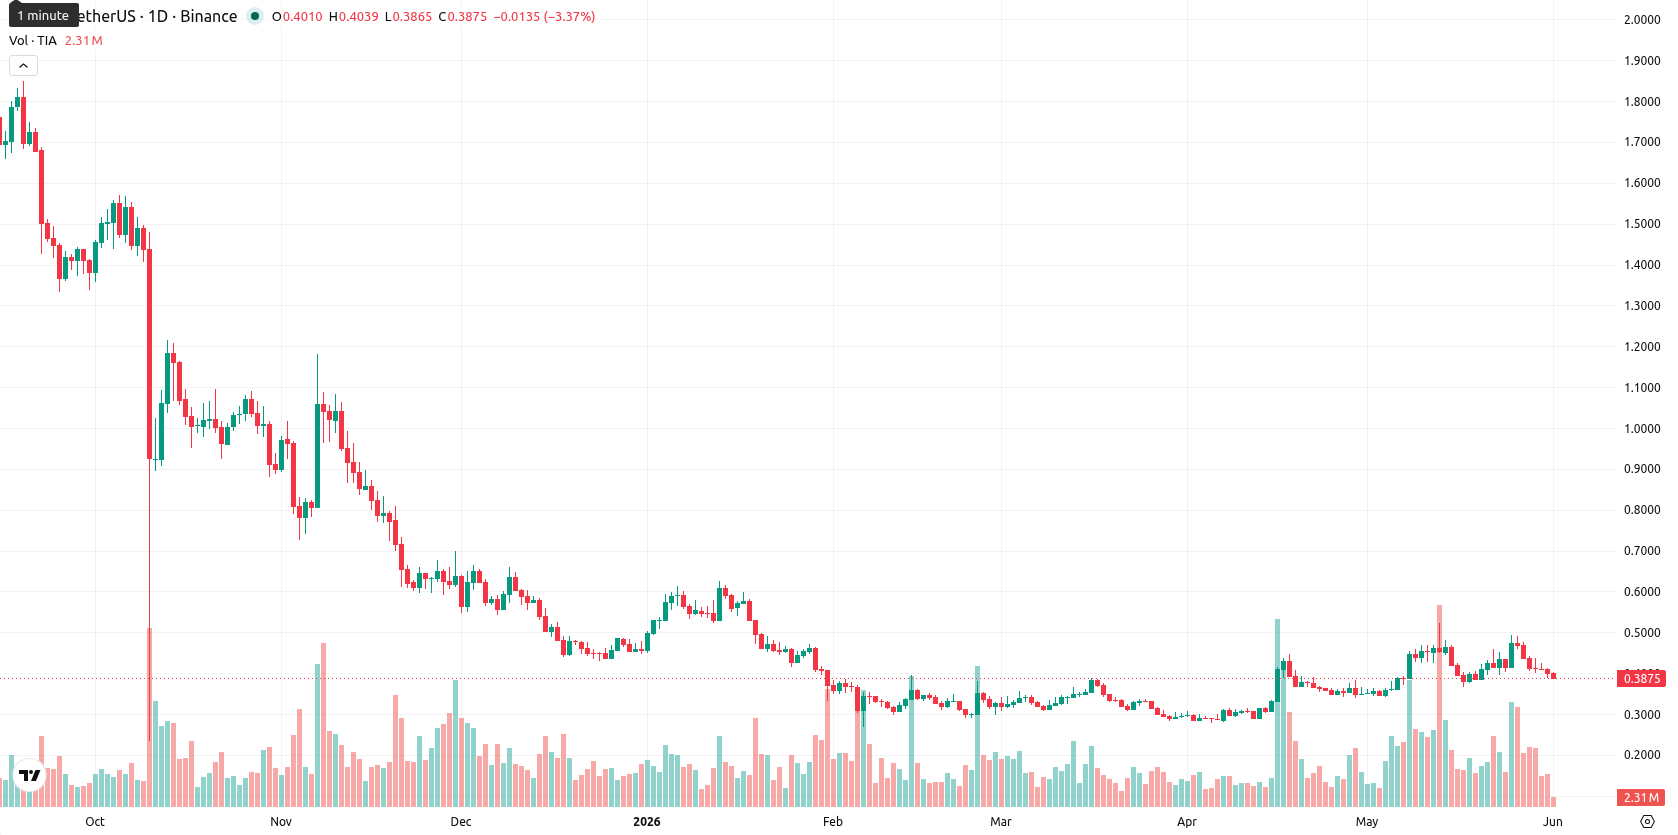
Celestia (TIA) is trading at $0.3899, which is above the MA-20 ($0.3597) but remains well below both the MA-50 ($0.8985) and the MA-200 ($0.4846). Over the past week, TIA declined $0.0495 (11.27%), closing at the bottom of its weekly range, reflecting ongoing selling pressure and continued weakness relative to medium- and long-term moving averages.
Highlights
- Celestia (TIA) continues to face a persistent downward trend, with sellers dominating both medium- and long-term momentum.
- Indicators are mixed, with most momentum signals supporting a bearish outlook despite brief short-term buyer presence.
- TIA is expected to consolidate between $0.36 and $0.43 this week, with higher probability for further downside if support fails.
Mixed technical signals as negative momentum persists this week
On the weekly chart, Celestia continues to show a negative momentum profile, with the MACD in Strong Sell territory and the ADX at 24.08, pointing to a weak but persistent downward trend. The weekly RSI stands at 41.87, supporting a Sell outlook, while the Stochastic RSI is in Overbought territory and the Commodity Channel Index signals a Buy, indicating divergence among oscillators. Price remains above the MA-20 ($0.3597), but is capped by the MA-50 at $0.8985 and faces additional resistance at the MA-200 ($0.4846). Weekly volatility is elevated at 26.24%, and the Awesome Oscillator is neutral, confirming the lack of strong consensus among technical indicators.
Bearish consolidation expected unless key resistance breaks next week
For the next 7 days, TIA is expected to trade between $0.36 and $0.43, tracking historical volatility and recent ranges. The probability of a decisive upward move is limited to about 25%, given the overwhelming negative momentum and only one key weekly indicator on Buy. The baseline scenario favors further consolidation near current levels, with a push above $0.43 required for a bullish reversal. If selling persists and support fails, the price could slip below $0.36, reinforcing the bearish outlook.
Earlier, analysts noted that Celestia was exhibiting mixed technical signals with a bias toward continued downside risk. The latest developments confirm this bearish momentum, making a sustained move above $0.43 the key threshold for any potential reversal in the coming week.


Latest Celestia News


-
 Afghanistan
-
 Albania
-
 Algeria
-
 Angola
-
 Argentina
-
 Armenia
-
 Australia
-
 Austria
-
 Azerbaijan
-
 Bahamas
-
 Bahrain
-
 Bangladesh
-
 Belarus
-
 Belgium
-
 Bolivia
-
 Botswana
-
 Brazil
-
 Brunei
-
 Bulgaria
-
 Cambodia
-
 Cameroon
-
 Canada
-
 Chile
Chile
-
 China
China
-
 Colombia
-
 Congo
Congo
-
 Costa Rica
-
 Cote d'Ivoire
-
 Croatia
-
 Cuba
Cuba
-
 Cyprus
-
 Czechia
-
 DR Congo
-
 Denmark
-
 Dominican Republic
-
 Ecuador
-
 Egypt
Egypt
-
 El Salvador
-
 Estonia
-
 Eswatini
-
 Ethiopia
-
 Finland
-
 France
-
 Georgia
-
 Germany
-
 Ghana
Ghana
-
 Greece
-
 Haiti
Haiti
-
 Hong Kong
-
 Hungary
-
 India
India
-
 Indonesia
-
 Iran, Islamic republic
-
 Iraq
Iraq
-
 Ireland
-
 Israel
-
 Italy
Italy
-
 Jamaica
-
 Japan
Japan
-
 Jordan
-
 Kazakhstan
-
 Kenya
Kenya
-
 Korea
Korea
-
 Kuwait
-
 Kyrgyzstan
-
 Laos
Laos
-
 Latvia
-
 Lebanon
-
 Lesotho
-
 Libya
Libya
-
 Lithuania
-
 Luxembourg
-
 Madagascar
-
 Malaysia
-
 Malta
Malta
-
 Mauritius
-
 Mexico
-
 Moldova
-
 Mongolia
-
 Montenegro
-
 Morocco
-
 Mozambique
-
 Myanmar
-
 Namibia
-
 Nepal
Nepal
-
 Netherlands
-
 New Zealand
-
 Nigeria
-
 North Macedonia
-
 Norway
-
 Oman
Oman
-
 Pakistan
-
 Palestine
-
 Panama
-
 Papua New Guinea
-
 Paraguay
-
 Peru
Peru
-
 Philippines
-
 Poland
-
 Portugal
-
 Puerto Rico
-
 Qatar
Qatar
-
 Reunion
-
 Romania
-
 Rwanda
-
 Saudi Arabia
-
 Serbia
-
 Singapore
-
 Slovakia
-
 Slovenia
-
 Somalia
-
 South Africa
-
 Spain
Spain
-
 Sri Lanka
-
 Sweden
-
 Switzerland
-
 Syria
Syria
-
 Taiwan
-
 Tajikistan
-
 Tanzania
-
 Thailand
-
 Trinidad and Tobago
-
 Tunisia
-
 Turkey
-
 UAE
UAE
-
 Uganda
-
 Ukraine
-
 United Kingdom
-
United States
-
 Uruguay
-
 Uzbekistan
-
 Venezuela
-
 Vietnam
-
 Yemen
Yemen
-
 Zambia
-
 Zimbabwe
- Forex
- Crypto
