
Pendle price prediction: Can $1.7525 resistance cap further upside? PENDLE adds 7.60%

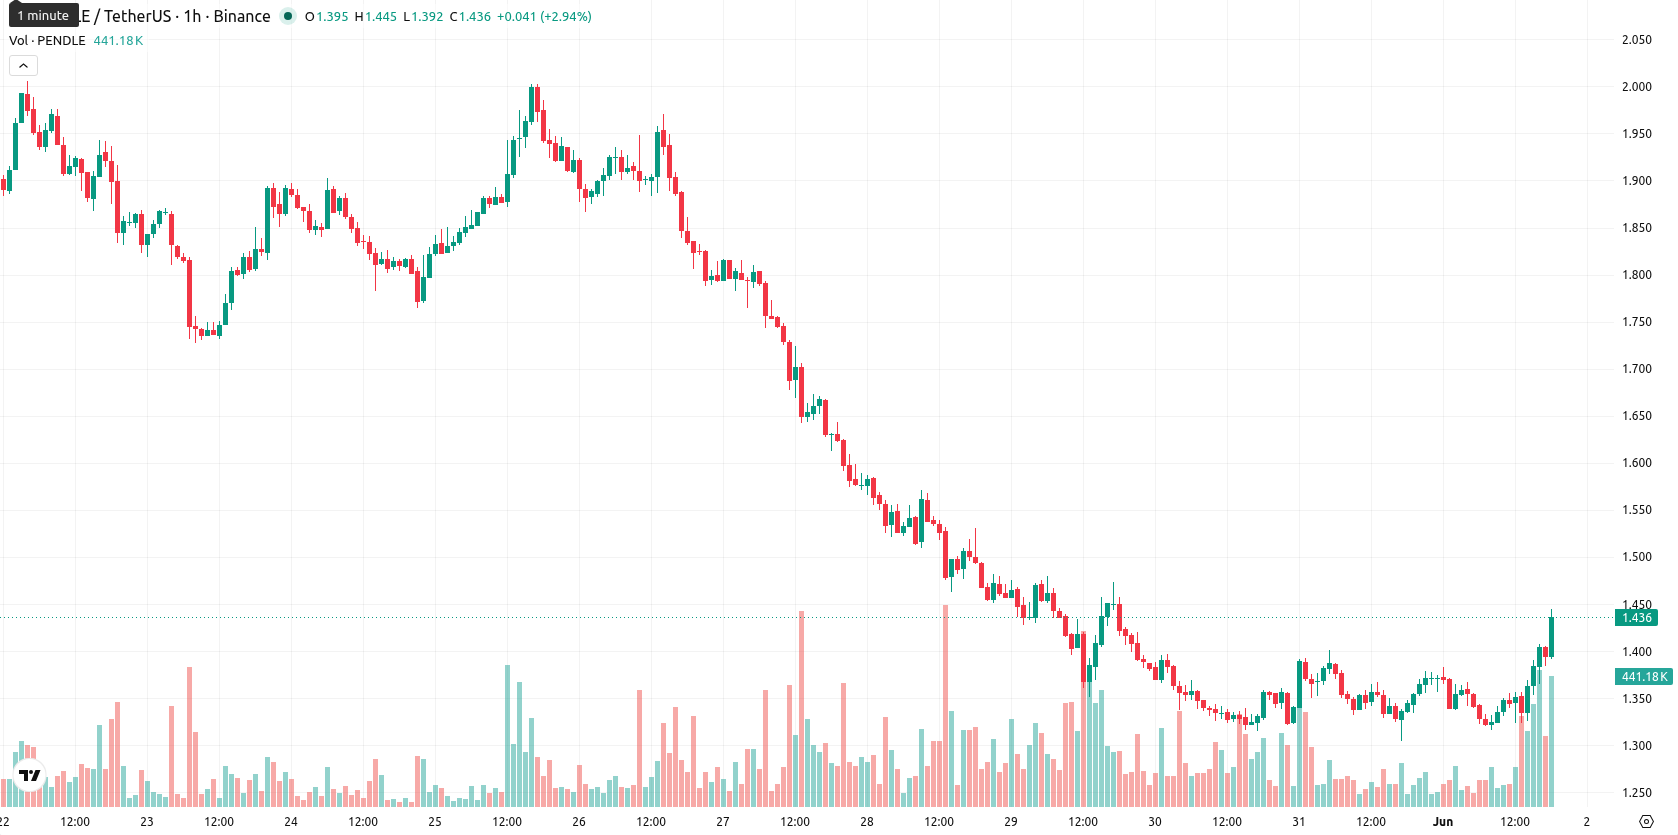
Pendle (PENDLE) is trading at $1.444, advancing by 7.60% on the session and positioning below its key moving averages. The asset’s price action reflects ongoing volatility as it climbs higher during today’s session.
Highlights
- PENDLE remains under consistent selling pressure, trading below key moving averages across multiple timeframes.
- Oscillator signals indicate deep oversold conditions, but underlying momentum remains bearish and signals further risk to the downside.
- The price is likely to consolidate between $1.30 and $1.60 over the next five days, with less than a 20% chance of a sustained upside move.
Bearish momentum persists as oversold signals and resistance align
On the technical front, PENDLE trades below the SMA-20 ($1.7675), SMA-50 ($1.6042), and SMA-200 ($1.6917), while the Ichimoku Kijun level at $1.7525 serves as notable resistance above spot levels. Daily momentum indicators show the MACD and ADX signaling sell, with the RSI at 35.93, Stoch RSI at 6.93, and CCI at –170.20—all indicating oversold conditions. BBP readings remain negative and AO reinforces the prevailing downside momentum. Intraday price action has rebounded near session highs, but this occurs amid strong oversold oscillator signals and continued bearish technical momentum, highlighting a potential divergence.
Limited breakout potential as consolidation confines price range
Looking ahead to the next five days, the expected volatility band lies between $1.30 and $1.60, with consolidation between these levels as the baseline scenario. The likelihood of an upside breakout above $1.75 is low (less than 20%), though such a move could trigger rapid short covering. A break below $1.30 may invite additional weakness and fresh lows as the prevailing trend resumes.
Earlier, analysts noted that Pendle was experiencing persistent bearish momentum and a lack of stabilization. The current rebound amid oversold signals suggests volatility remains elevated, so traders should closely monitor the $1.30 support for signs of further weakness if selling pressure resumes.


Latest Pendle News


-
 Afghanistan
-
 Albania
-
 Algeria
-
 Angola
-
 Argentina
-
 Armenia
-
 Australia
-
 Austria
-
 Azerbaijan
-
 Bahamas
-
 Bahrain
-
 Bangladesh
-
 Belarus
-
 Belgium
-
 Bolivia
-
 Botswana
-
 Brazil
-
 Brunei
-
 Bulgaria
-
 Cambodia
-
 Cameroon
-
 Canada
-
 Chile
Chile
-
 China
China
-
 Colombia
-
 Congo
Congo
-
 Costa Rica
-
 Cote d'Ivoire
-
 Croatia
-
 Cuba
Cuba
-
 Cyprus
-
 Czechia
-
 DR Congo
-
 Denmark
-
 Dominican Republic
-
 Ecuador
-
 Egypt
Egypt
-
 El Salvador
-
 Estonia
-
 Eswatini
-
 Ethiopia
-
 Finland
-
 France
-
 Georgia
-
 Germany
-
 Ghana
Ghana
-
 Greece
-
 Haiti
Haiti
-
 Hong Kong
-
 Hungary
-
 India
India
-
 Indonesia
-
 Iran, Islamic republic
-
 Iraq
Iraq
-
 Ireland
-
 Israel
-
 Italy
Italy
-
 Jamaica
-
 Japan
Japan
-
 Jordan
-
 Kazakhstan
-
 Kenya
Kenya
-
 Korea
Korea
-
 Kuwait
-
 Kyrgyzstan
-
 Laos
Laos
-
 Latvia
-
 Lebanon
-
 Lesotho
-
 Libya
Libya
-
 Lithuania
-
 Luxembourg
-
 Madagascar
-
 Malaysia
-
 Malta
Malta
-
 Mauritius
-
 Mexico
-
 Moldova
-
 Mongolia
-
 Montenegro
-
 Morocco
-
 Mozambique
-
 Myanmar
-
 Namibia
-
 Nepal
Nepal
-
 Netherlands
-
 New Zealand
-
 Nigeria
-
 North Macedonia
-
 Norway
-
 Oman
Oman
-
 Pakistan
-
 Palestine
-
 Panama
-
 Papua New Guinea
-
 Paraguay
-
 Peru
Peru
-
 Philippines
-
 Poland
-
 Portugal
-
 Puerto Rico
-
 Qatar
Qatar
-
 Reunion
-
 Romania
-
 Rwanda
-
 Saudi Arabia
-
 Serbia
-
 Singapore
-
 Slovakia
-
 Slovenia
-
 Somalia
-
 South Africa
-
 Spain
Spain
-
 Sri Lanka
-
 Sweden
-
 Switzerland
-
 Syria
Syria
-
 Taiwan
-
 Tajikistan
-
 Tanzania
-
 Thailand
-
 Trinidad and Tobago
-
 Tunisia
-
 Turkey
-
 UAE
UAE
-
 Uganda
-
 Ukraine
-
 United Kingdom
-
United States
-
 Uruguay
-
 Uzbekistan
-
 Venezuela
-
 Vietnam
-
 Yemen
Yemen
-
 Zambia
-
 Zimbabwe
- Forex
- Crypto
