
+7.82% for Optimism as price pivots away from long-term average

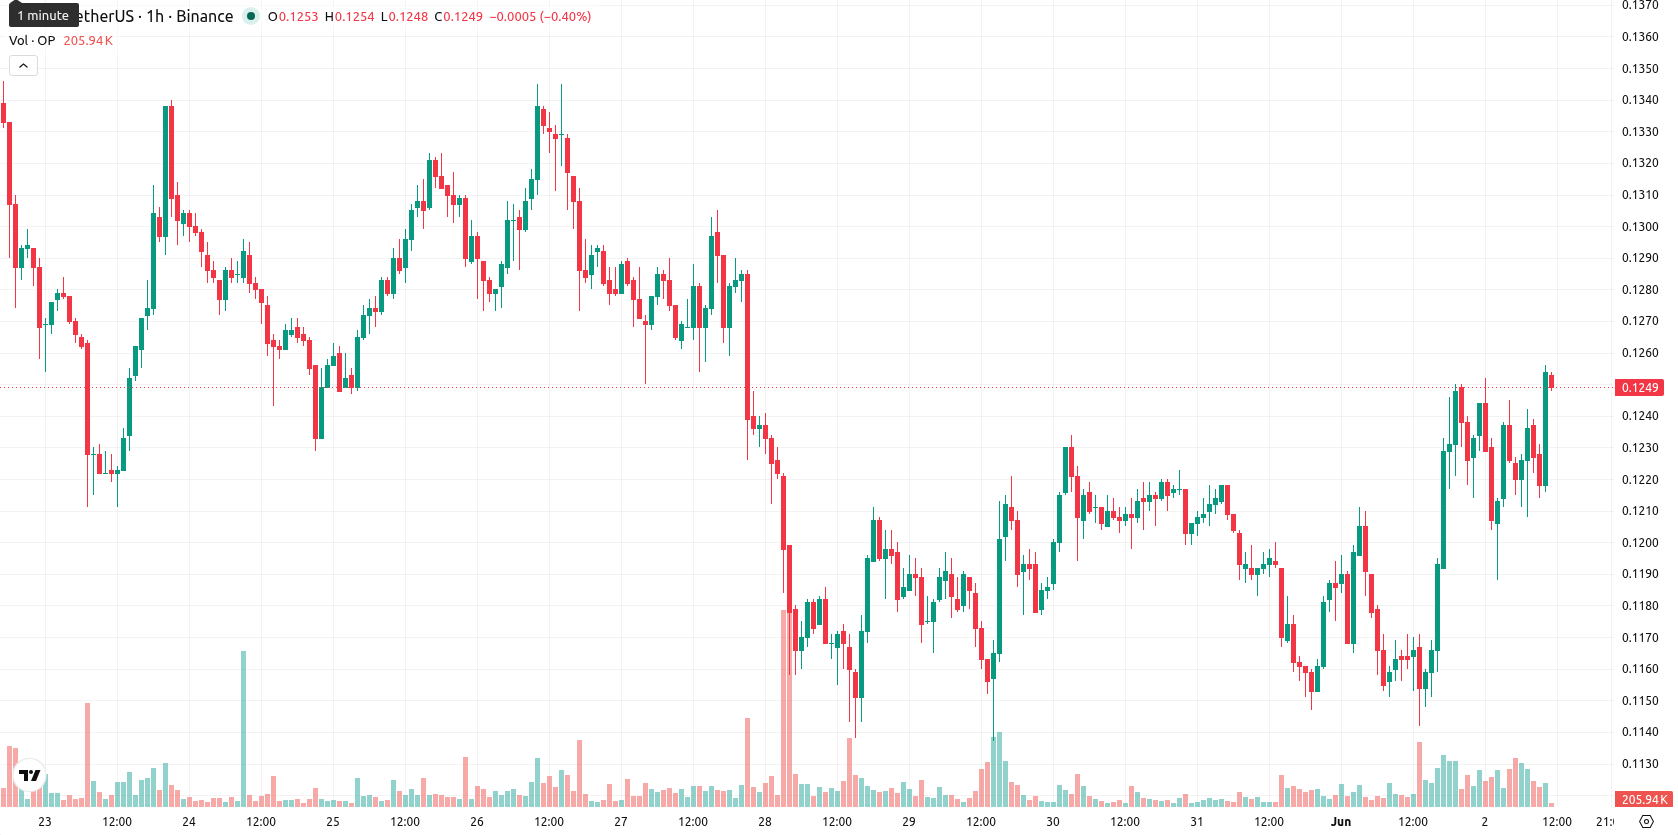
Optimism (OP) is trading at $0.1254, up 7.82% on the day and holding near the top of its daily range after a strong open. The asset currently sits below its key short-term and long-term moving averages.
Highlights
- OP trades under major moving averages, indicating sustained bearish sentiment across short, medium, and long-term horizons.
- Daily indicators remain bearish overall, though select intraday momentum signals reflect sporadic buyer interest and increased volatility.
- Expect OP to consolidate between $0.118 and $0.133 over the next week, with downside risk prevailing unless resistance at $0.1478 is breached.
Persistent resistance and weak trend as bearish signals dominate
OP has traded below the SMA-20 at $0.1285, SMA-50 at $0.1300, and remains well under the SMA-200 at $0.2039, confirming that resistance persists at these levels. The Ichimoku Kijun provides further resistance at $0.1478. Daily MACD shows a sell bias, and ADX is weak at 13.4, indicating low trend strength. Both daily RSI and CCI are in sell territory, suggesting that downside momentum or weak buying persists. However, the Stoch RSI and BBP show strong intraday buy signals, highlighting the potential for short-term upside pressure despite a generally bearish bias on higher timeframes. Price action is close to the top of the current range ($0.1188 – $0.1252), signaling volatility and attempts to recover.
Range-bound trading expected as bearish momentum curbs upside
Over the next five trading days, OP is likely to consolidate within a typical volatility band between $0.118 and $0.133. The probability of a sustained move higher is low, with less than a 20% chance, as all key weekly signals (RSI, ADX, MACD, and MA-50) remain bearish. In the most probable scenario, price stabilizes in this corridor, reflecting ongoing indecision. A break above immediate resistance at $0.1478 would signal the start of a bullish scenario, although this appears unlikely without a shift in momentum. A breakdown below $0.120 would likely trigger further weakness and set up a retest of recent lows.
Previously it was reported that Optimism remained under bearish pressure, with little evidence of a sustained recovery amid persistent resistance. The current analysis reinforces this cautious outlook, emphasizing that a decisive move above $0.1478 remains the key level to monitor for any meaningful shift in trend dynamics.


-
 Afghanistan
-
 Albania
-
 Algeria
-
 Angola
-
 Argentina
-
 Armenia
-
 Australia
-
 Austria
-
 Azerbaijan
-
 Bahamas
-
 Bahrain
-
 Bangladesh
-
 Belarus
-
 Belgium
-
 Bolivia
-
 Botswana
-
 Brazil
-
 Brunei
-
 Bulgaria
-
 Cambodia
-
 Cameroon
-
 Canada
-
 Chile
Chile
-
 China
China
-
 Colombia
-
 Congo
Congo
-
 Costa Rica
-
 Cote d'Ivoire
-
 Croatia
-
 Cuba
Cuba
-
 Cyprus
-
 Czechia
-
 DR Congo
-
 Denmark
-
 Dominican Republic
-
 Ecuador
-
 Egypt
Egypt
-
 El Salvador
-
 Estonia
-
 Eswatini
-
 Ethiopia
-
 Finland
-
 France
-
 Georgia
-
 Germany
-
 Ghana
Ghana
-
 Greece
-
 Haiti
Haiti
-
 Hong Kong
-
 Hungary
-
 India
India
-
 Indonesia
-
 Iran, Islamic republic
-
 Iraq
Iraq
-
 Ireland
-
 Israel
-
 Italy
Italy
-
 Jamaica
-
 Japan
Japan
-
 Jordan
-
 Kazakhstan
-
 Kenya
Kenya
-
 Korea
Korea
-
 Kuwait
-
 Kyrgyzstan
-
 Laos
Laos
-
 Latvia
-
 Lebanon
-
 Lesotho
-
 Libya
Libya
-
 Lithuania
-
 Luxembourg
-
 Madagascar
-
 Malaysia
-
 Malta
Malta
-
 Mauritius
-
 Mexico
-
 Moldova
-
 Mongolia
-
 Montenegro
-
 Morocco
-
 Mozambique
-
 Myanmar
-
 Namibia
-
 Nepal
Nepal
-
 Netherlands
-
 New Zealand
-
 Nigeria
-
 North Macedonia
-
 Norway
-
 Oman
Oman
-
 Pakistan
-
 Palestine
-
 Panama
-
 Papua New Guinea
-
 Paraguay
-
 Peru
Peru
-
 Philippines
-
 Poland
-
 Portugal
-
 Puerto Rico
-
 Qatar
Qatar
-
 Reunion
-
 Romania
-
 Rwanda
-
 Saudi Arabia
-
 Serbia
-
 Singapore
-
 Slovakia
-
 Slovenia
-
 Somalia
-
 South Africa
-
 Spain
Spain
-
 Sri Lanka
-
 Sweden
-
 Switzerland
-
 Syria
Syria
-
 Taiwan
-
 Tajikistan
-
 Tanzania
-
 Thailand
-
 Trinidad and Tobago
-
 Tunisia
-
 Turkey
-
 UAE
UAE
-
 Uganda
-
 Ukraine
-
 United Kingdom
-
United States
-
 Uruguay
-
 Uzbekistan
-
 Venezuela
-
 Vietnam
-
 Yemen
Yemen
-
 Zambia
-
 Zimbabwe
- Forex
- Crypto
