
Optimism gains as price rebounds from deeply discounted levels

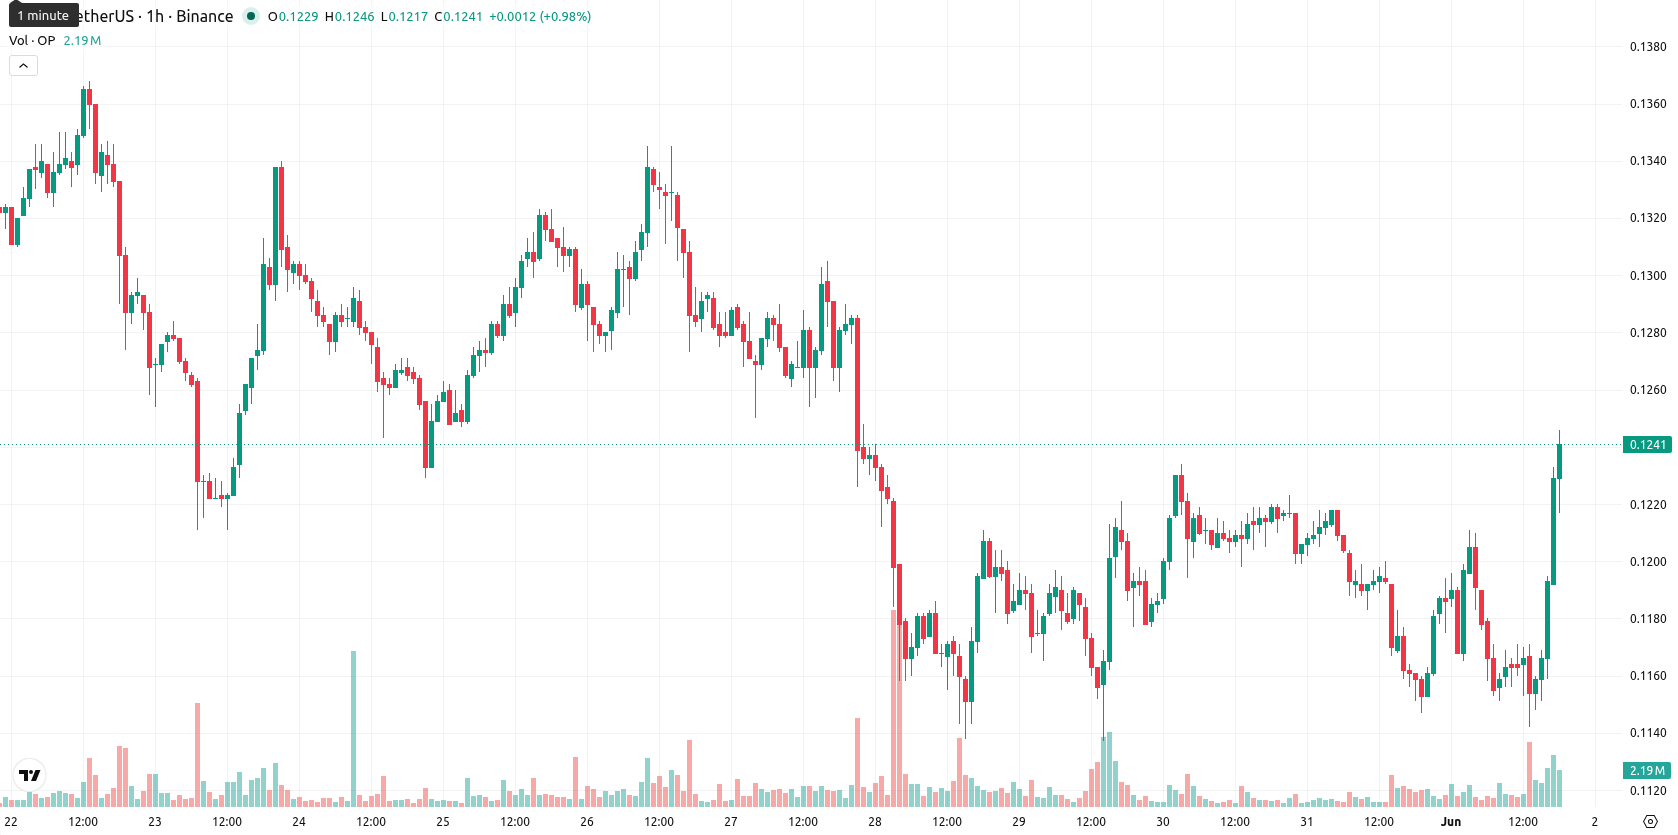
Optimism (OP) is trading at $0.1243, gaining 7.53% on the day in a move contrary to prevailing short- and medium-term trends. The asset remains below its key moving averages, signaling continued caution despite the current session's strength.
Highlights
- OP shows prevailing bearish momentum, trading below key moving averages and with long-term downward pressure dominant.
- Momentum and oscillator signals remain weak to mixed, with some short-term oversold conditions but no clear reversal.
- Expected five-day price range is $0.1180–$0.1370, with a less than 20% probability of a sustained rally and likely sideways to downward movement unless $0.1478 resistance breaks.
Multiple resistances and weak momentum curtail bullish attempts
The 20-day ($0.1299), 50-day ($0.1297), and 200-day ($0.2052) moving averages all remain above OP’s current level. The Ichimoku Kijun line at $0.1478 acts as immediate resistance, while momentum remains weak. The D1 MACD points to a downtrend and ADX reads 13.68, indicating modest trend strength. Oversold signals are displayed by RSI (39.4), CCI (–116.6), and Stoch RSI (4.94), suggesting short-term exhaustion in selling pressure. BBP is negative, highlighting continued seller dominance within the session. OP closed near the top of today's range with heightened intraday volatility, but mixed momentum and oscillator signals persist.
Sideways drift likely unless key levels are breached
Over the next five trading days, OP is expected to fluctuate within a typical volatility band of $0.1180 to $0.1370 around current levels. The likelihood of additional upside is low (below 20%), with the base scenario being a sideways consolidation near present prices. A bullish move would require a decisive break above $0.1478 resistance, while renewed downside could occur if support at $0.1180 is breached and sellers resume control.
Previously it was reported that Optimism faced persistent bearish momentum and limited signs of recovery amid ongoing seller pressure. The current uptick, while notable, has yet to shift the underlying trend, so traders should closely monitor for a confirmed break above the Ichimoku Kijun at $0.1478 as a signal of potential trend reversal.


Latest Optimism News


-
 Afghanistan
-
 Albania
-
 Algeria
-
 Angola
-
 Argentina
-
 Armenia
-
 Australia
-
 Austria
-
 Azerbaijan
-
 Bahamas
-
 Bahrain
-
 Bangladesh
-
 Belarus
-
 Belgium
-
 Bolivia
-
 Botswana
-
 Brazil
-
 Brunei
-
 Bulgaria
-
 Cambodia
-
 Cameroon
-
 Canada
-
 Chile
Chile
-
 China
China
-
 Colombia
-
 Congo
Congo
-
 Costa Rica
-
 Cote d'Ivoire
-
 Croatia
-
 Cuba
Cuba
-
 Cyprus
-
 Czechia
-
 DR Congo
-
 Denmark
-
 Dominican Republic
-
 Ecuador
-
 Egypt
Egypt
-
 El Salvador
-
 Estonia
-
 Eswatini
-
 Ethiopia
-
 Finland
-
 France
-
 Georgia
-
 Germany
-
 Ghana
Ghana
-
 Greece
-
 Haiti
Haiti
-
 Hong Kong
-
 Hungary
-
 India
India
-
 Indonesia
-
 Iran, Islamic republic
-
 Iraq
Iraq
-
 Ireland
-
 Israel
-
 Italy
Italy
-
 Jamaica
-
 Japan
Japan
-
 Jordan
-
 Kazakhstan
-
 Kenya
Kenya
-
 Korea
Korea
-
 Kuwait
-
 Kyrgyzstan
-
 Laos
Laos
-
 Latvia
-
 Lebanon
-
 Lesotho
-
 Libya
Libya
-
 Lithuania
-
 Luxembourg
-
 Madagascar
-
 Malaysia
-
 Malta
Malta
-
 Mauritius
-
 Mexico
-
 Moldova
-
 Mongolia
-
 Montenegro
-
 Morocco
-
 Mozambique
-
 Myanmar
-
 Namibia
-
 Nepal
Nepal
-
 Netherlands
-
 New Zealand
-
 Nigeria
-
 North Macedonia
-
 Norway
-
 Oman
Oman
-
 Pakistan
-
 Palestine
-
 Panama
-
 Papua New Guinea
-
 Paraguay
-
 Peru
Peru
-
 Philippines
-
 Poland
-
 Portugal
-
 Puerto Rico
-
 Qatar
Qatar
-
 Reunion
-
 Romania
-
 Rwanda
-
 Saudi Arabia
-
 Serbia
-
 Singapore
-
 Slovakia
-
 Slovenia
-
 Somalia
-
 South Africa
-
 Spain
Spain
-
 Sri Lanka
-
 Sweden
-
 Switzerland
-
 Syria
Syria
-
 Taiwan
-
 Tajikistan
-
 Tanzania
-
 Thailand
-
 Trinidad and Tobago
-
 Tunisia
-
 Turkey
-
 UAE
UAE
-
 Uganda
-
 Ukraine
-
 United Kingdom
-
United States
-
 Uruguay
-
 Uzbekistan
-
 Venezuela
-
 Vietnam
-
 Yemen
Yemen
-
 Zambia
-
 Zimbabwe
- Forex
- Crypto
