
The Graph drops with price trading well below its long-term average

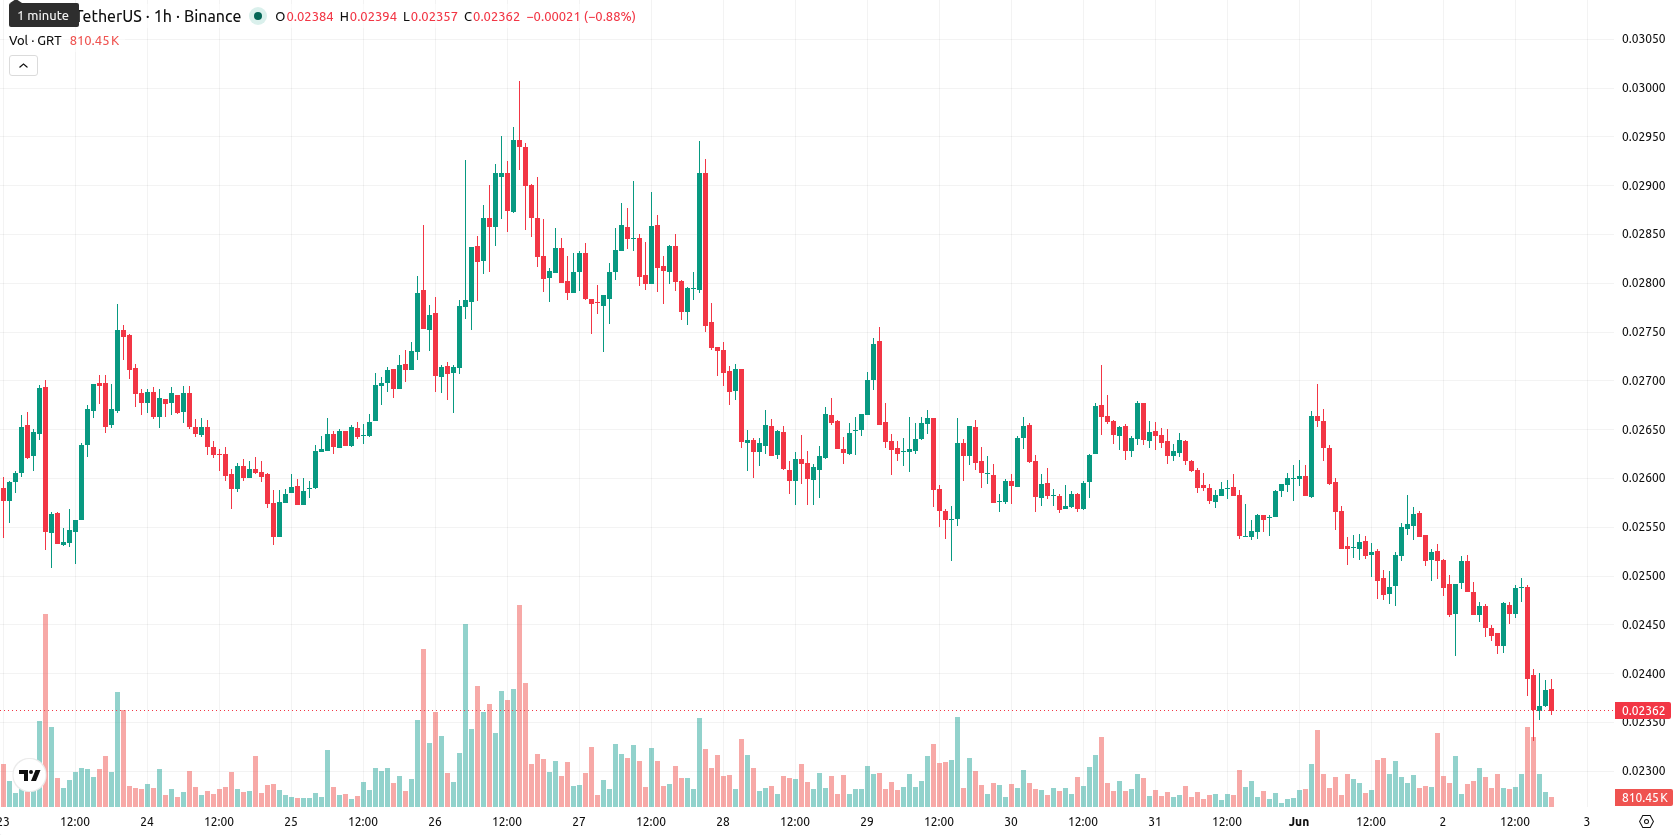
The Graph (GRT) is trading at $0.023681 after a daily decline of 7.53%. The asset remains below its key moving averages, reflecting continued downward momentum relative to short-, medium-, and long-term benchmarks.
Highlights
- GRT remains under persistent downside pressure, trading below key moving averages across all timeframes.
- Momentum indicators signal oversold conditions following a sharp 7.5% daily drop and continued selling from the open.
- GRT is likely to consolidate between $0.0220 and $0.0255 with less than 20% probability of a near-term price rebound.
Oversold signals deepen as resistance caps technical recovery
On the technical side, GRT is trading below its SMA-20 ($0.026234), SMA-50 ($0.025748), and SMA-200 ($0.032462), while the Ichimoku Kijun level at $0.027210 acts as immediate resistance. Daily momentum remains mixed: the MACD is neutral, the ADX indicates steady trend strength, and key oscillators—RSI (44), Stoch RSI (4.7), and CCI (-61)—are deep in oversold territory. BBP edges into positive territory, favoring intraday buyers, but the Awesome Oscillator continues to confirm the prevailing downtrend.
Limited rebound potential as sellers drive near-term consolidation
Over the next five trading days, GRT is expected to remain within a typical volatility band of $0.0220–$0.0255, reflecting current price levels. The probability of a price increase is low, with sideways consolidation as the baseline scenario while selling pressure dominates. A sustained bullish reversal would require a close above resistance at $0.0272, whereas a push below recent lows could trigger a retest of the $0.0220 area or lower if the bearish momentum continues.
Earlier, analysts noted that The Graph was experiencing sustained bearish momentum with limited signs of recovery. Current technical signals reinforce this outlook, with deep oversold conditions suggesting consolidation may persist near recent lows, making a decisive break above the $0.0272 resistance crucial for any potential trend reversal.


-
 Afghanistan
-
 Albania
-
 Algeria
-
 Angola
-
 Argentina
-
 Armenia
-
 Australia
-
 Austria
-
 Azerbaijan
-
 Bahamas
-
 Bahrain
-
 Bangladesh
-
 Belarus
-
 Belgium
-
 Bolivia
-
 Botswana
-
 Brazil
-
 Brunei
-
 Bulgaria
-
 Cambodia
-
 Cameroon
-
 Canada
-
 Chile
Chile
-
 China
China
-
 Colombia
-
 Congo
Congo
-
 Costa Rica
-
 Cote d'Ivoire
-
 Croatia
-
 Cuba
Cuba
-
 Cyprus
-
 Czechia
-
 DR Congo
-
 Denmark
-
 Dominican Republic
-
 Ecuador
-
 Egypt
Egypt
-
 El Salvador
-
 Estonia
-
 Eswatini
-
 Ethiopia
-
 Finland
-
 France
-
 Georgia
-
 Germany
-
 Ghana
Ghana
-
 Greece
-
 Haiti
Haiti
-
 Hong Kong
-
 Hungary
-
 India
India
-
 Indonesia
-
 Iran, Islamic republic
-
 Iraq
Iraq
-
 Ireland
-
 Israel
-
 Italy
Italy
-
 Jamaica
-
 Japan
Japan
-
 Jordan
-
 Kazakhstan
-
 Kenya
Kenya
-
 Korea
Korea
-
 Kuwait
-
 Kyrgyzstan
-
 Laos
Laos
-
 Latvia
-
 Lebanon
-
 Lesotho
-
 Libya
Libya
-
 Lithuania
-
 Luxembourg
-
 Madagascar
-
 Malaysia
-
 Malta
Malta
-
 Mauritius
-
 Mexico
-
 Moldova
-
 Mongolia
-
 Montenegro
-
 Morocco
-
 Mozambique
-
 Myanmar
-
 Namibia
-
 Nepal
Nepal
-
 Netherlands
-
 New Zealand
-
 Nigeria
-
 North Macedonia
-
 Norway
-
 Oman
Oman
-
 Pakistan
-
 Palestine
-
 Panama
-
 Papua New Guinea
-
 Paraguay
-
 Peru
Peru
-
 Philippines
-
 Poland
-
 Portugal
-
 Puerto Rico
-
 Qatar
Qatar
-
 Reunion
-
 Romania
-
 Rwanda
-
 Saudi Arabia
-
 Serbia
-
 Singapore
-
 Slovakia
-
 Slovenia
-
 Somalia
-
 South Africa
-
 Spain
Spain
-
 Sri Lanka
-
 Sweden
-
 Switzerland
-
 Syria
Syria
-
 Taiwan
-
 Tajikistan
-
 Tanzania
-
 Thailand
-
 Trinidad and Tobago
-
 Tunisia
-
 Turkey
-
 UAE
UAE
-
 Uganda
-
 Ukraine
-
 United Kingdom
-
United States
-
 Uruguay
-
 Uzbekistan
-
 Venezuela
-
 Vietnam
-
 Yemen
Yemen
-
 Zambia
-
 Zimbabwe
- Forex
- Crypto
