
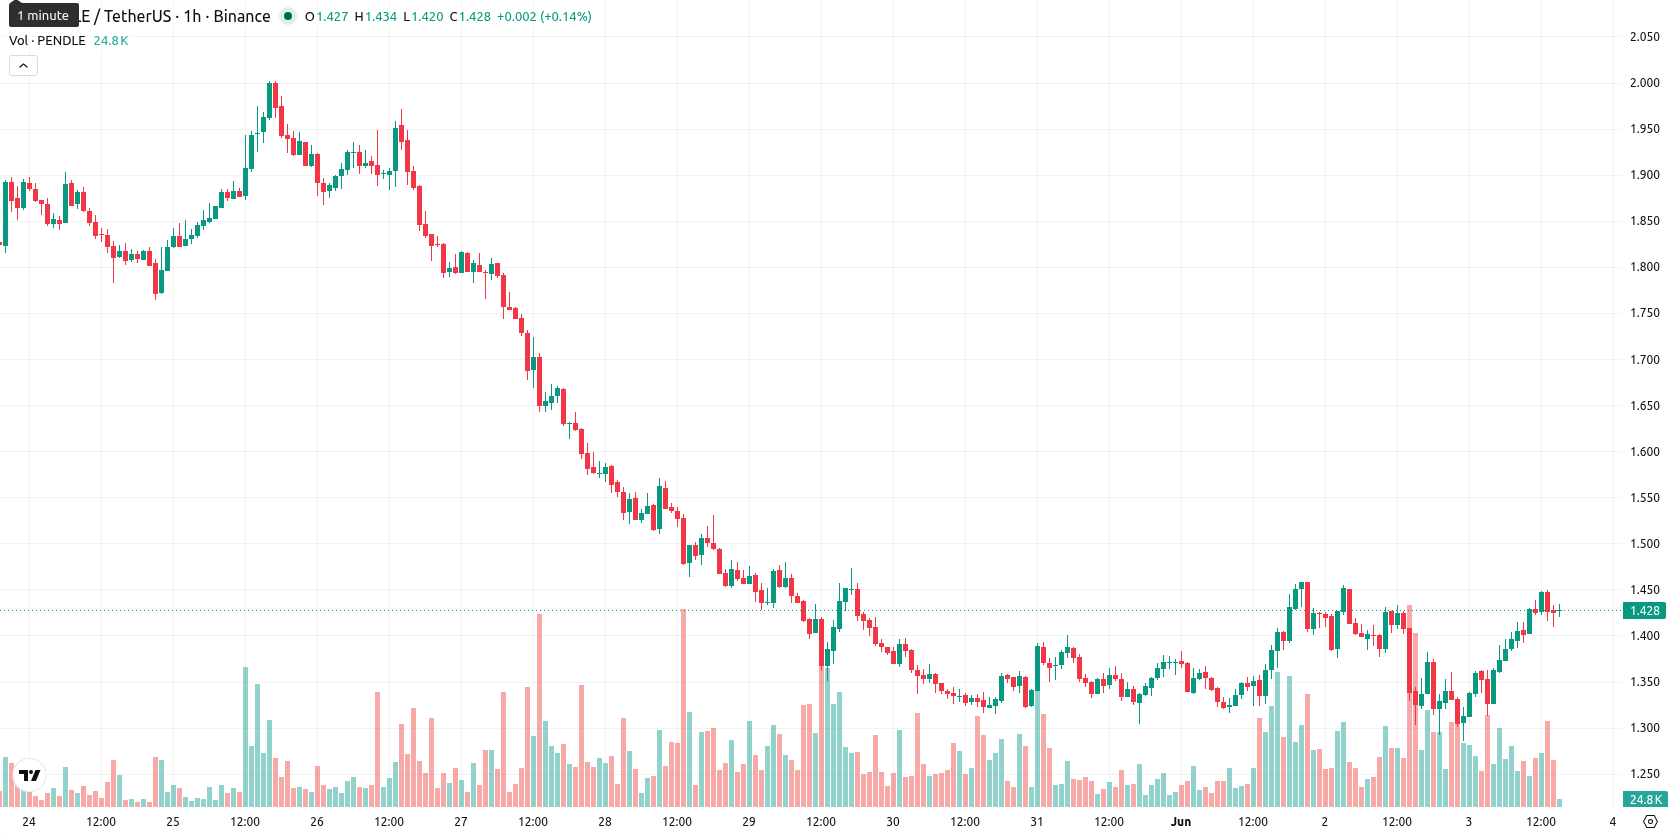
+7.03% for Pendle as the token rebounds from heavy selling pressure

Pendle (PENDLE) is trading at $1.431, representing a 7.03% daily gain. The asset remains below its key moving averages, reflecting a lack of immediate technical support.
Highlights
- PENDLE trades below key moving averages, reflecting persistent bearish momentum and a lack of sustained support.
- Oscillator signals indicate oversold conditions despite today's 7% intraday rebound, highlighting a divergence between short-term demand and broader weakness.
- Price is expected to consolidate between $1.30 and $1.55 over the next five days, with downside risk dominating unless $1.74 resistance is breached.
Bearish momentum as major resistance and oversold signals converge
On the technical front, PENDLE's price is trading below its SMA-20 ($1.7040), SMA-50 ($1.6156), and SMA-200 ($1.6822) levels. The D1 Ichimoku Kijun at $1.7430 defines immediate resistance, while intraday momentum readings show MACD in a sell configuration and ADX confirming sustained bearish market dynamics. Oscillator signals indicate deeply oversold conditions, with RSI at 34.6, Stoch RSI near 1.2, and CCI in oversold territory. Bull/Bear Power (BBP) reflects strong seller dominance on the day, despite the sharp price move higher.
Sideways bias expected as downside risk outweighs rally odds
Looking ahead, the anticipated 5-day volatility band for PENDLE lies between $1.30 and $1.55. With both daily and weekly technical indicators maintaining a negative bias, there is less than a 20% chance of a sustained price rally from current levels, suggesting further downside is more likely. Baseline expectations favor sideways consolidation within this corridor, while a bullish breakout would require clearing the $1.74 resistance zone. In contrast, renewed selling could drive PENDLE back below $1.31 if bearish momentum accelerates.
Earlier, analysts noted that Pendle was experiencing persistent bearish momentum and sustained technical weakness. The most recent price rebound does little to alter this outlook, with the asset still lacking technical support, so traders should closely monitor for signs of renewed selling pressure that could drive Pendle to fresh local lows.


Latest Pendle News


-
 Afghanistan
-
 Albania
-
 Algeria
-
 Angola
-
 Argentina
-
 Armenia
-
 Australia
-
 Austria
-
 Azerbaijan
-
 Bahamas
-
 Bahrain
-
 Bangladesh
-
 Belarus
-
 Belgium
-
 Bolivia
-
 Botswana
-
 Brazil
-
 Brunei
-
 Bulgaria
-
 Cambodia
-
 Cameroon
-
 Canada
-
 Chile
Chile
-
 China
China
-
 Colombia
-
 Congo
Congo
-
 Costa Rica
-
 Cote d'Ivoire
-
 Croatia
-
 Cuba
Cuba
-
 Cyprus
-
 Czechia
-
 DR Congo
-
 Denmark
-
 Dominican Republic
-
 Ecuador
-
 Egypt
Egypt
-
 El Salvador
-
 Estonia
-
 Eswatini
-
 Ethiopia
-
 Finland
-
 France
-
 Georgia
-
 Germany
-
 Ghana
Ghana
-
 Greece
-
 Haiti
Haiti
-
 Hong Kong
-
 Hungary
-
 India
India
-
 Indonesia
-
 Iran, Islamic republic
-
 Iraq
Iraq
-
 Ireland
-
 Israel
-
 Italy
Italy
-
 Jamaica
-
 Japan
Japan
-
 Jordan
-
 Kazakhstan
-
 Kenya
Kenya
-
 Korea
Korea
-
 Kuwait
-
 Kyrgyzstan
-
 Laos
Laos
-
 Latvia
-
 Lebanon
-
 Lesotho
-
 Libya
Libya
-
 Lithuania
-
 Luxembourg
-
 Madagascar
-
 Malaysia
-
 Malta
Malta
-
 Mauritius
-
 Mexico
-
 Moldova
-
 Mongolia
-
 Montenegro
-
 Morocco
-
 Mozambique
-
 Myanmar
-
 Namibia
-
 Nepal
Nepal
-
 Netherlands
-
 New Zealand
-
 Nigeria
-
 North Macedonia
-
 Norway
-
 Oman
Oman
-
 Pakistan
-
 Palestine
-
 Panama
-
 Papua New Guinea
-
 Paraguay
-
 Peru
Peru
-
 Philippines
-
 Poland
-
 Portugal
-
 Puerto Rico
-
 Qatar
Qatar
-
 Reunion
-
 Romania
-
 Rwanda
-
 Saudi Arabia
-
 Serbia
-
 Singapore
-
 Slovakia
-
 Slovenia
-
 Somalia
-
 South Africa
-
 Spain
Spain
-
 Sri Lanka
-
 Sweden
-
 Switzerland
-
 Syria
Syria
-
 Taiwan
-
 Tajikistan
-
 Tanzania
-
 Thailand
-
 Trinidad and Tobago
-
 Tunisia
-
 Turkey
-
 UAE
UAE
-
 Uganda
-
 Ukraine
-
 United Kingdom
-
United States
-
 Uruguay
-
 Uzbekistan
-
 Venezuela
-
 Vietnam
-
 Yemen
Yemen
-
 Zambia
-
 Zimbabwe
- Forex
- Crypto
