

Kava loses ground amid trading well below its long-term average

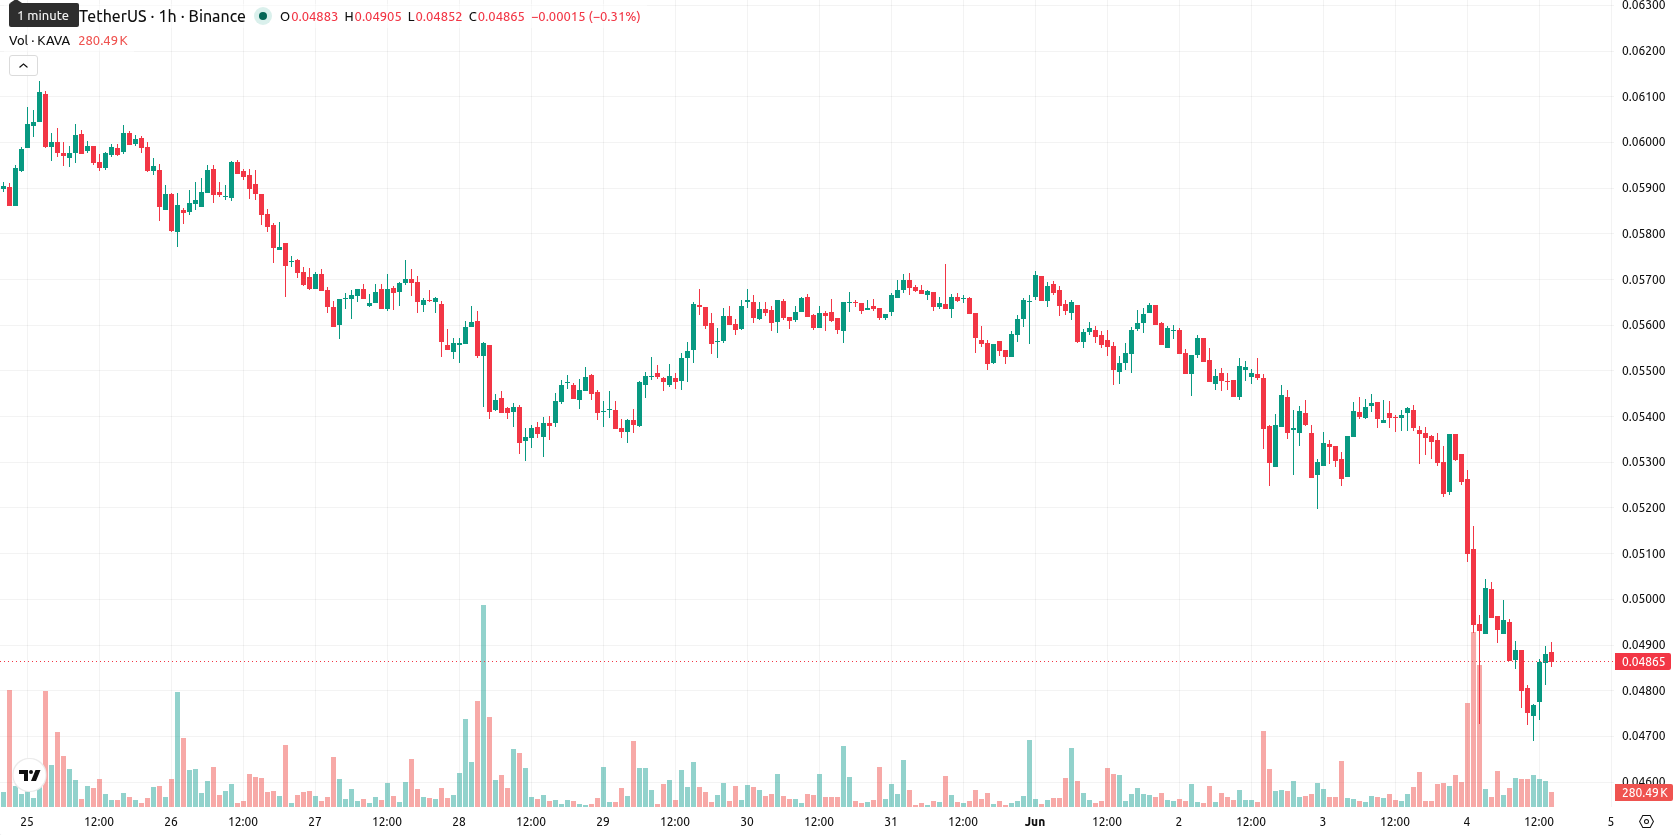
Kava (KAVA) is trading at $0.0489, down 9.20% on the day. The asset currently sits below its key moving averages, reflecting a strong session of downward momentum.
 0.0271
0.0387
Highlights
- KAVA/USD trades below key moving averages across timeframes, confirming persistent bearish pressure from sellers.
- Momentum indicators are aligned to the downside, with strong sell signals dominating despite a brief technical divergence.
- Price is projected to remain range-bound between $0.0477 and $0.0501 over the next 2–3 sessions, with downside risk prevailing.
Technical momentum deteriorates as multiple indicators signal sustained selling
On the H1 timeframe, KAVA/USD trades below the MA-20 ($0.0502) and MA-50 ($0.0524) levels. The daily chart shows price action remaining under the MA-200 ($0.0714), while immediate resistance is formed by the Ichimoku Kijun at $0.0506. Momentum signals reinforce the selling tone: the MACD and ADX both indicate a strong sell bias, RSI prints 35.4 (Sell), CCI signals Sell, and BBP continues with a Sell indication. Stoch RSI is currently Overbought, creating a divergence as oscillators suggest emerging downside but Stoch RSI warns of limited near-term selling. The Awesome Oscillator remains neutral.
Downside scenario prevails as breakout odds remain low
KAVA/USD is expected to remain within the $0.0477–$0.0501 volatility band over the next two to three trading days. The likelihood of an upward breakout is considered very low, while downside risk is pronounced, making any sustained bounce improbable in the near term. The baseline scenario favors sideways movement inside the projected corridor. A break above the $0.0506 resistance would be needed to shift toward a bullish scenario, whereas a move below the $0.0477 support would reinforce bearish pressure.
Earlier, analysts noted that Kava was exhibiting persistent weakness and heightened downside risk amid sustained bearish technical signals. The current session reinforces this outlook, with momentum and volatility indicators favoring a continuation of rangebound trading and highlighting the importance of monitoring a potential break below $0.0477 as the next catalyst for directional movement.










-
 Afghanistan
-
 Albania
-
 Algeria
-
 Angola
-
 Argentina
-
 Armenia
-
 Australia
-
 Austria
-
 Azerbaijan
-
 Bahamas
-
 Bahrain
-
 Bangladesh
-
 Belarus
-
 Belgium
-
 Bolivia
-
 Botswana
-
 Brazil
-
 Brunei
-
 Bulgaria
-
 Cambodia
-
 Cameroon
-
 Canada
-
 Chile
-
 China
-
 Colombia
-
 Congo
-
 Costa Rica
-
 Cote d'Ivoire
-
 Croatia
-
 Cuba
-
 Cyprus
-
 Czechia
-
 DR Congo
-
 Denmark
-
 Dominican Republic
-
 Ecuador
-
 Egypt
-
 El Salvador
-
 Estonia
-
 Eswatini
-
 Ethiopia
-
 Finland
-
 France
-
 Georgia
-
 Germany
-
 Ghana
-
 Greece
-
 Haiti
-
 Hong Kong
-
 Hungary
-
 India
-
 Indonesia
-
 Iran, Islamic republic
-
 Iraq
-
 Ireland
-
 Israel
-
 Italy
-
 Jamaica
-
 Japan
-
 Jordan
-
 Kazakhstan
-
 Kenya
-
 Korea
-
 Kuwait
-
 Kyrgyzstan
-
 Laos
-
 Latvia
-
 Lebanon
-
 Lesotho
-
 Libya
-
 Lithuania
-
 Luxembourg
-
 Madagascar
-
 Malaysia
-
 Malta
-
 Mauritius
-
 Mexico
-
 Moldova
-
 Mongolia
-
 Montenegro
-
 Morocco
-
 Mozambique
-
 Myanmar
-
 Namibia
-
 Nepal
-
 Netherlands
-
 New Zealand
-
 Nigeria
-
 North Macedonia
-
 Norway
-
 Oman
-
 Pakistan
-
 Palestine
-
 Panama
-
 Papua New Guinea
-
 Paraguay
-
 Peru
-
 Philippines
-
 Poland
-
 Portugal
-
 Puerto Rico
-
 Qatar
-
 Reunion
-
 Romania
-
 Rwanda
-
 Saudi Arabia
-
 Serbia
-
 Singapore
-
 Slovakia
-
 Slovenia
-
 Somalia
-
 South Africa
-
 Spain
-
 Sri Lanka
-
 Sweden
-
 Switzerland
-
 Syria
-
 Taiwan
-
 Tajikistan
-
 Tanzania
-
 Thailand
-
 Trinidad and Tobago
-
 Tunisia
-
 Turkey
-
 UAE
-
 Uganda
-
 Ukraine
-
 United Kingdom
-
United States
-
 Uruguay
-
 Uzbekistan
-
 Venezuela
-
 Vietnam
-
 Yemen
-
 Zambia
-
 Zimbabwe
- Forex
- Crypto












